Illustrative Mathematics
Placing a Fire Hydrant
Triangle centers and the segments that create them easily become an exercise in memorization, without the help of engaging applications like this lesson. Here the class investigates the measure of center that is equidistant to the three...
Statistics Education Web
What Does the Normal Distribution Sound Like?
Groups collect data describing the number of times a bag of microwave popcorn pops at given intervals. Participants discover that the data fits a normal curve and answer questions based on the distribution of this data.
Project Maths
Introduction to Angles
Approach the instructional activity from the right angle. A discussion-based instructional activity leads helps learners understand angles in terms of rotation. Individuals use manipulatives to explore the properties of angles and learn...
Teach Engineering
Stormy Skies
Young meteorologists examine the four main types of weather fronts and how they appear on a weather map. Participants learn about the difference between the types of weather fronts along with their distinguishing features. A...
Illustrative Mathematics
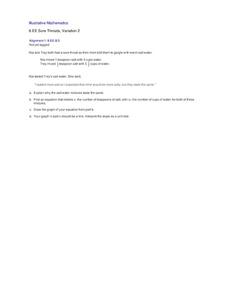
Sore Throats, Variation 2
What does math have to do with a sore throat? When you mix water and salt you have a great review of how to represent proportional relationships by an equation or graph. Here the proportions of the mixtures may be different, but the...
Mathematics Assessment Project
Sampling and Estimating: Counting Trees
Your task today: count all the trees on a tree farm. To complete the assignment, learners first estimate the number of trees on a tree farm using random sampling. To improve their own response they then evaluate provided responses to the...
Statistics Education Web
You Will Soon Analyze Categorical Data (Classifying Fortune Cookie Fortunes)
Would you rely on a fortune cookie for advice? The lesson first requires future statisticians to categorize 100 fortune cookie fortunes into four types: prophecy, advice, wisdom, and misc. The lesson goes on to have learners use...
Statistics Education Web
I Always Feel Like Somebody's Watching Me
Future statisticians and potential psychics first conduct an experiment to collect data on whether a person can tell if someone is staring at them. Statistical methods, such as hypothesis testing, chi-square tests, binomial tests, and...
Virginia Department of Education
Curve of Best Fit
Which function models the data best? Pupils work through several activities to model data with a variety of functions. Individuals begin by reviewing the shapes of the functions and finding functions that will fit plotted data points. By...
Polar Trec
Ozone Data Comparison over the South Pole
Did you know the hole in the ozone is seasonal and filled by January every year? The lesson uses scientific measurements of the ozone over the South Pole to understand patterns. Scholars learn that the hole grew bigger annually before...
Alabama Learning Exchange
Triangle Congruence with Rigid Motion
Combine transformations and triangle congruence in a single lesson. Scholars learn to view congruent triangles as a rigid transformation. Using triangle congruence criteria, learners identify congruent triangles and the rigid...
American Statistical Association
How Random Is the iPod’s Shuffle?
Shuffle the resource into your instructional activity repertoire. Scholars use randomly-generated iPod Shuffle playlists to develop ideas about randomness. They use a new set of playlists to confirm their ideas, and then decide whether...
American Statistical Association
Chocolicious
To understand how biased data is misleading, learners analyze survey data and graphical representations. They use that information to design their own plans to collect information on consumer thoughts about Chocolicious cereal.
American Statistical Association
Colors Challenge!
Does writing the name of a color in a different colored ink affect one's ability to read it? Scholars design an experiment to answer this question. They collect the data, analyze the statistics, and draw a conclusion based on what they...
Statistics Education Web
It’s Elemental! Sampling from the Periodic Table
How random is random? Demonstrate the different random sampling methods using a hands-on activity. Pupils use various sampling techniques to choose a random sample of elements from the periodic table. They use the different samples to...
Statistics Education Web
The Case of the Careless Zookeeper
Herbivores and carnivores just don't get along. Using a box of animal crackers, classes collect data about the injury status of herbivores and carnivores in the box. They complete the process of chi-square testing on the data from...
Curated OER
The Game is Afoot - A Study of Sherlock Holmes
Mystery is an exciting genre for young readers to investigate. The plots are so intriguing! Here is a series of lessons featuring Sherlock Holmes stories that invite learners to enter the world of the mystery genre. Based on what they...
Illustrative Mathematics
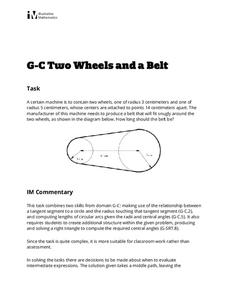
Two Wheels and a Belt
Geometry gets an engineering treatment in an exercise involving a belt wrapped around two wheels of different dimensions. Along with the wheels, this belt problem connects concepts of right triangles, tangent lines, arc length, and...
Curated OER
Linear, Square, and Cubic Units
Linear, square, and cubic units are all investigated as different types of packages are measured. The teacher will need supplies such as a box of aluminum foil, a package of ribbon, and a bag of mulch. The class determines the...
Curated OER
Area Applet
Elementary math classes calculate the area of a shape and explain the correlation between the size of the perimeter and the areas that can be contained within that perimeter. They also explain the effect the shape of the perimeter has on...
Curated OER
Shaking Up Ice Cream
Upper graders use a variety of tools to measure liquid and solid ingredients in an ice cream making recipe. Following written and oral directions and accurately timing themselves forms the basis of this lesson.
Curated OER
And You Thought Gasoline Was Expensive!
Students carry out a cost analysis. For this comparative math lesson, students compare the cost of equal measures of gasoline to mouthwash, house paint, fruit juice, white-out, and other liquids.
Curated OER
How Many Units?
Young mathematicians calculate the area of rectangles and squares. In this geometry instructional activity, learners are grouped in pairs and use geoboards to construct rectangles. They calculate the area of the figure by counting the...
Curated OER
Square Roots Using a Carpenter's Square
Young scholars calculate the square root of a given number using carpenter's square measurements. In this math lesson plan, students relate this method on the Pythagorean theorem. They answer practice problems after the exploration...


