American Statistical Association
What Fits?
The bounce of a golf ball changes the result in golf, mini golf—and a great math activity. Scholars graph the height of golf ball bounces before finding a line of best fit. They analyze their own data and the results of others to better...
Curated OER
Time Travel
Elementary schoolers practice measuring elapsed time between events. Learners work together to complete a worksheet, embedded in the plan, on elapsed time. The puzzle they must solve takes some time to complete. One of the tasks each...
Curated OER
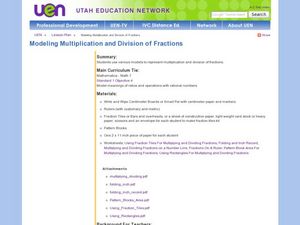
Modeling Multiplication and Division of Fractions
Create models to demonstrate multiplication and division of fractions. Using fraction tiles to model fractions, pupils explore fractions on a ruler and use pattern blocks to multiply and divide. They also create number lines with fractions.
Curated OER
Flight Dreams - Folding into Flight
Combine measurement, following directions, physics, and art with one fun activity. Learners read a set of instruction to create three different kinds of paper airplanes. They measure, fold, and fly the planes, and record data and answer...
National Security Agency
Partying with Proportions and Percents
Examine ratios and proportions in several real-world scenarios. Children will calculate unit rates, work with proportions and percentages as they plan a party, purchase produce, and take a tally. This lesson plan recommends five...
Curated OER
The Search for Centimeters
Investigate the length of various objects in metrics! In this measurement lesson, 2nd graders estimate and find the length of objects in the classroom using centimeters.
EngageNY
Modeling with Polynomials—An Introduction (part 2)
Linear, quadratic, and now cubic functions can model real-life patterns. High schoolers create cubic regression equations to model different scenarios. They then use the regression equations to make predictions.
Curated OER
Math On Your Lap Quilt
Get creative juices flowing when you allow groups to figure out a procedure for how to find the area of squares and rectangles. They may use the individual patchwork blocks, or they may design one using the Design Template.
Curated OER
Telling Time, Part 2
Compare time on an analog clock and a digital clock with a learning exercise that prompts third graders to write the given times into both clocks. An example at the top of the page demonstrates how to write the time for both clocks. A...
Achieve
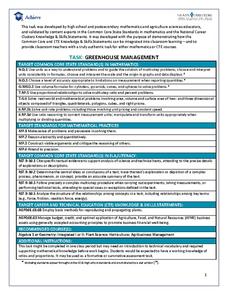
Greenhouse Management
Who knew running a greenhouse required so much math? Amaze future mathematicians and farmers with the amount of unit conversions, ratio and proportional reasoning, and geometric applications involved by having them complete the...
Teach Engineering
Energy on a Roller Coaster
Roll with your class into the idea of conservation of energy. Pupils use a roller coaster track to collect data to reinforce the concept of conservation of energy and the influence of friction. Class members then create a graph from...
Illustrative Mathematics
Logistic Growth Model, Abstract Version
Here learners get to flex some serious algebraic muscles through an investigation of logistic growth. The properties of the constant terms in the logistic growth formula are unraveled in a short but content-dense activity. Moving...
Mathematics Assessment Project
Modeling Motion: Rolling Cups
Connect the size of a rolling cup to the size of circle it makes. Pupils view videos of cups of different sizes rolling in a circle. Using the videos and additional data, they attempt to determine a relationship between cup measurements...
Project Maths
Planes and Points
Build a solid foundation on which to develop future concepts. Through a guided exploration, learners compare and contrast the characteristics of points, lines, planes, rays, and segments. They measure lengths and practice notation for...
Curated OER
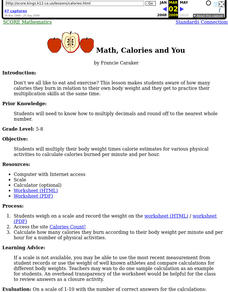
Math, Calories and You
Discover the connection between calories and weight. Pupils multiply their body weight times calorie estimates for various physical activities to calculate calories burned per minute and per hour. Worksheets a well as website links are...
National Wildlife Federation
Massive Migrations
Turn your students into flocks of migratory birds for this fun activity on animal migration. Prior to the activity, the teacher creates four different migration routes in the classroom or any available open space, labeling nesting...
MENSA Education & Research Foundation
Pi Day Fun!
In this multi-faceted introduction to pi, participants perform a bevy of pi-related activities. Ranging from measuring household items to singing pi songs and reading pi stories, this fun and non-intimidating resource serves to bring up...
Curated OER
My Angle on Cooling
Students explore how the angle and distance of an object can change it's temperature. After reviewing how the position of the Earth affects the temperature of the planet, student groups design and perform an experiment to test how...
Illustrative Mathematics
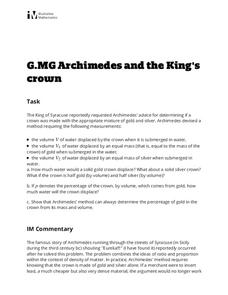
Archimedes and the King's Crown
Learners will shout "Eureka!" in this quick but deep activity replicating the famous bathtub experiment of Archimedes. Given the scenario of a king with a suspected fake crown, young investigators develop formulas using density to...
Curated OER
Shapes and Tools
Young learners view different shapes drawn by the teacher on the board. The teacher identifies each shape by name and discusses the importance of knowing the difference between shapes when building something. The pupils complete the...
Curated OER
Rescue Mission Game
Students conduct probability experiments. For this rescue mission lesson plan, sudents play a game and collect statistical data. They organize and interpret the data and determine the probability of success. Students plot points on a...
Curated OER
Piecewise Linear Functions: Extending Stories to Graphs
Using this resource, scholars develop graphs that model situations by showing change over time. They answer 15 questions based on information from charts that show growth in weight. They extend the concepts to an assessment section of...
Curated OER
The Art of Interpreting Percent
Ddefine the relationships between fractions, decimals, and percentages in a series of lessons. The class practices converting between these three versions of a number. They also find the common factor of a numerator and denominator and...
CK-12 Foundation
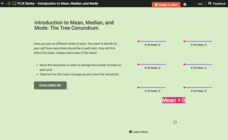
Introduction to Mean, Median, and Mode: The Tree Conundrum
How many trees should we plant? Using an interactive as a manipulative, individuals find the mean, median, and mode for sets of data. They determine the number of trees to plant in each plot of land to reach a statistical goal.


