Curated OER
Summer Body Activity: As Big as Me!
Learners explore things that are their size, literally. In this early childhood lesson plan, students use their bodies for measuring and comparing sizes as they work in pairs to complete the activity.
West Contra Costa Unified School District
Congruent and Similar Polygons
What's similar about congruent and similar polygons? Young mathematicians first measure the side lengths and angles of given figures. They use these measurements to determine relationships between side lengths and angles of congruent and...
EngageNY
Law of Cosines
Build upon the Pythagorean Theorem with the Law of Cosines. The 10th part of a 16-part series introduces the Law of Cosines. Class members use the the geometric representation of the Pythagorean Theorem to develop a proof of the Law of...
Institute of Electrical and Electronics Engineers
Spring Scale Engineering
After examining how a spring scale works, teams work together to design their own general measurement device. Reading material provides background information, but there is no part of the procedure in which learners handle an actual...
Curated OER
Cubed Containers
Learners explore volume in relation to centimeter cubes and other nonstandard units of measurement using small containers. They will use hands-on materials to practice this concept. You will need small objects and containers to set this up.
Curated OER
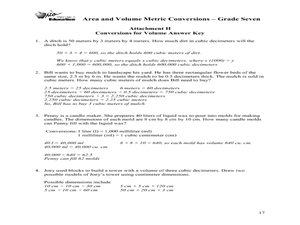
Area and Volume Metric Conversions - Grade Seven
Students investigate unit conversion. For this unit conversion lesson, students will build models of square and cubic centimeters using grid paper and generate formula tables for converting units of area and volume. The tables will be...
Shodor Education Foundation
Pythagorean Theorem
Most adults remember learning about the Pythagorean theorem, but they don't all remember how to use it. The emphasis here is on developing an intuitive understanding of how and when to use the theorem. Young mathematicians explore...
EngageNY
Interpreting Correlation
Is 0.56 stronger than -0.78? Interpret the correlation coefficient as the strength and direction of a linear relationship between two variables. An algebra lesson introduces the correlation coefficient by estimating and then calculating it.
EngageNY
The Inscribed Angle Alternate – A Tangent Angle
You know the Inscribed Angle Theorem and you know about tangent lines; now let's consider them together! Learners first explore angle measures when one of the rays of the angle is a tangent to a circle. They then apply their newfound...
Ohio Department of Education
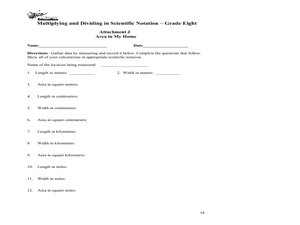
Multiplying and Dividing in Scientific Notation - Grade 8
Here is really nice set of resources on scientific notation. Eighth and ninth graders explore the concept of multiplying and dividing in scientific notation. In this multiplying and dividing numbers in scientific notation instructional...
Shodor Education Foundation
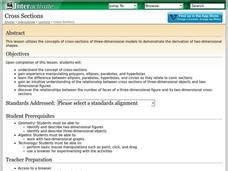
Cross Sections
Use this activity on cross-sections of three-dimensional shapes in your math class to work on algebra or geometry Common Core standards. The instructional activity includes a list of relevent terminology, and a step-by-step process to...
Bowland
DanceStar
Express dance moves mathematically. Scholars dissect dance routines and express them using mathematical notation, such as translations and rotations. They use video clips to investigate seven different dance genres.
Curated OER
Converting Between Units
Upper graders practice using measurements by solving conversion problems. There are given different time or measurement increments and must convert them to a larger or smaller increment. They also utilize a calculator and conversion...
Curated OER
Representing Data 1: Using Frequency Graphs
Here is a lesson that focuses on the use of frequency graphs to identify a range of measures and makes sense of data in a real-world context as well as constructing frequency graphs given information about the mean, median, and range of...
EngageNY
Describing Center, Variability, and Shape of a Data Distribution from a Graphical Representation
What is the typical length of a yellow perch? Pupils analyze a histogram of lengths for a sample of yellow perch from the Great Lakes. They determine which measures of center and variability are best to use based upon the shape of the...
Curated OER
An Uncomfortable Situation
If shapes have the same area, do they always have the same perimeter? Learners explore the relationship between the area of square units and their perimeters in a hands-on activity. Observations are recorded, and they begin to recognize...
Curated OER
Getting it Right! An Investigation of the Pythagorean Theorem
In order to learn about the Pythagorean Theorem, young mathematicians investigate relations and patterns between different sides of a right triangle to look for possible relations among the squared sides. Once they have established the...
Texas Instruments
Properties of Parabolas
Explore the properties of parabolas in this lesson. Construct a parabola given a focus and a directrix on the Ti-Nspire. Write equations of parabolas in vertex form and determine the a value of a parabola given a focus and directrix.
EngageNY
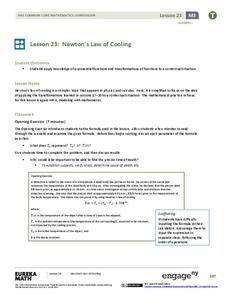
Newton’s Law of Cooling
As part of an investigation of transformations of exponential functions, class members use Newton's Law of Cooling as an exponential model to determine temperature based on varying aspects. The resource makes comparisons between models...
Curated OER
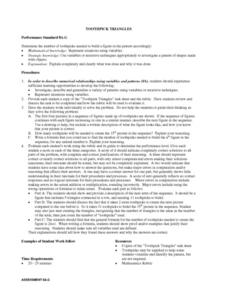
Toothpick Triangles
Learners draw a chart (included in the lesson) to use with their investigation. They review terminology of triangles and receive toothpicks to use in the lesson. Beginning with three toothpicks, students form a triangle. They complete...
EngageNY
Congruence Criteria for Triangles—ASA and SSS
How do you know if a pair of triangles are congruent? Use the lesson to help class members become comfortable identifying the congruence criteria. They begin with an exploration of ASA and SSS criteria through transformations and...
Curated OER
The Three M's of Statistics: Mode, Median, Mean
Young mathematicians use the Visual Thesaurus to define mean, median, and mode. In this mean, median and mode activity, learners use online sources to find the definitions of mean, median, and mode before applying the concepts to a class...
University of Georgia
Using Freezing-Point Depression to Find Molecular Weight
Explore the mathematical relationship between a solvent and solute. Learners use technology to measure the cooling patterns of a solvent with varying concentrations of solute. Through an analysis of the data, pupils realize that the rate...
Curated OER
Cold, Clouds, and Snowflakes
Students explore satellite data and graphing. In this weather data analysis math and science lesson, students analyze NASA satellite data to draw conclusions about geographical areas where precipitation might have happened. Students...


