Curated OER
The Mathematician And The Archaeologist
Students decorate clay pots and destroy them in order to learn the techniques of modern-day archaeologists and practice mathematical measurements. This is an exciting lesson suitable for Social Studies, Math, Science, or Art classroom.
Improving Measurement and Geometry in Elementary Schools
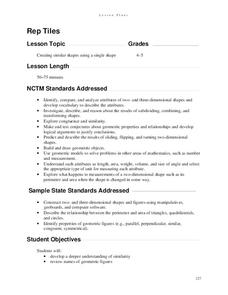
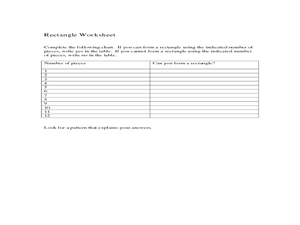
Rep Tiles
In addition to the catchy title, this lesson plan provides upper graders an opportunity to more closely scrutinize the attributes of plane figures. In particular, they focus on the similarity of different shapes. Both whole-class and...
Curated OER
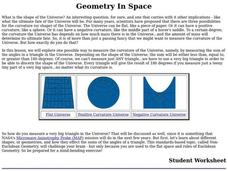
Geometry In Space
How can we identify shapes in the Universe? High schoolers will compare and contrast elliptic and hyperbolic geometry. They will also explore one possible way to measure the curvature of the Universe, namely, by measuring the sum of the...
Curated OER
A Mass of Pennies
Learners estimate and determine the number of cents (pennies) that are needed to equal the mass of a variety of common objects. They develop a process for measuring and explore concepts related to units of measurement.
Curated OER
We All Scream for Ice Scream
High schoolers explore the formulas for volume of three-dimensional objects. They participate in various activities involving ice cream, ice cream cones, small candies, and gum balls, recording their calculations on a lab sheet.
Alabama Learning Exchange
Abundant Area
Explore the relationship between perimeter and area. Learners input the area and perimeter for shapes on the Shape Explorer website, solve problems using geoboards, complete a worksheet, create a PowerPoint presentation, and take an...
Curated OER
Area of Tangram Pieces
Mathematicians calculate the area of a tangram piece without using formulas. They use a geometry journal to record activities during this lesson. They make a set of tangrams and use them to compute area. They use what they discover to...
Curated OER
Discovering Pi
Define terminology related to a circle. Practice accuracy in measuring and then create a spreadsheet based on data collected from solving for parts of a circle. Groups can have fun analyzing their data as it relates to Pi.
Statistics Education Web
Now You SeeIt, Now You Don't: Using SeeIt to Compare Stacked Dotplots to Boxplots
How does your data stack up? A hands-on activity asks pupils to collect a set of data by measuring their right-hand reach. Your classes then analyze their data using a free online software program and make conclusions as to the...
Workforce Solutions
30 Seconds
Thirty seconds are all scholars have to develop an engaging commercial to showcase their talents and experience within a specific occupation. Pairs work collaboratively to keep each other on time to deliver information speedily and ask...
Curated OER
Exploring Scale And Ratio
Students measure the actual size and distance of the solar system using scale and ratio. They watch and discuss a video, create a distance-scale solar system model, and compare the scale sizes of planets to their actual sizes.
Curated OER
TE Activity: Bubbling Plants
Students study a way to quantify the process of photosynthesis during a given time using the Elodea plant. They design a hypothesis that they test in the hands on activity. They compare the amounts of photosynthesis that occur during low...
Curated OER
Density - An Intrinsic Property
Learners discover the property of density while participating in a lab exercise. In this scientific measuring lesson, pupils utilize a scale to measure the density of different metal materials. They document their work and present their...
Curated OER
Finding the Area of Shapes
In this area of shapes unit, upper graders participate in hands-on problem solving activities to find the formulas for the area of a parallelogram, a triangle, and a trapezoid. They manipulate the geoboard to explore relationships among...
Scholastic
Cooking Dinner (Thanksgiving)
American traditions of Thanksgiving come to life through culinary activities. Young chefs practice cooking a turkey and setting a table for a Thanksgiving family feast. They use math and reading skills to follow directions and measure...
Curated OER
Statistics Canada
Students practice using graphing tools to make tables, bar charts, scatter graphs, and histograms, using census data. They apply the concept of measures of central tendency, examine the effects of outliers. They also write inferences and...
Curated OER
Angle Relationships
Students investigate geometric relationship using conjecture about linear pairs and vertical angles. In this geometry lesson, students apply their theorems and previous geometry knowledge to solve for and find angles of linear pairs....
Curated OER
What is Air?
Students investigate air by participating in a class experiment. In this matter measurement lesson, students identify air as a gas which consists of mass. Students utilize a windsock or balloon to measure oxygen and explore it's true...
Curated OER
Area, Perimeter and Rations Using Pentominoes
Learners of all ages investigate area and perimeter through pentominoes. In this geometry lesson, young scholars calculate the are and perimeter of different geometric shapes and describe the properties of similar and congruent shapes....
Arizona State University
Tricorn Triangles
Help your learners examine triangles. Pupils explore the different sizes and measurements of triangles. They discover triangles can be isosceles or scalene, and examine the attributes of triangles. Here is the website where you can find...
American Statistical Association
Step into Statastics
Class members study the size of classmates' feet and perform a statistical analysis of their data. They solve for central tendencies, quartiles, and spread for the entire group as well as subgroups. They then write a conclusion based on...
Curated OER
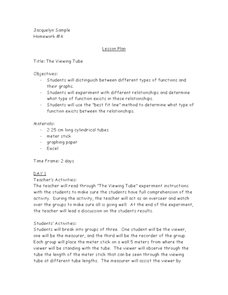
The Viewing Tube
Looking for an excellent lesson that incorporates math, science, and technology? Groups of three students use a viewing tube to perform an experiment, and discover how to organize their data into an Excel spreadsheet. This is a very...
Utah Education Network (UEN)
Linear Graphs Using Proportions and Rates
Using a TI-73 or other similar graphing calculator middle school math majors investigate the linear relationship of equivalent proportions. After a brief introduction by the teacher, class members participate in a timed pair share...
Curated OER
Weather instruments
Students explore weather instruments. In this weather lesson, students make rain gauges, anemometers, and barometers following the instructions given in the lesson. Students set up a weather station using their instruments and record and...


