Curated OER
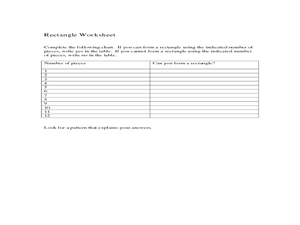
Finding the Area of Shapes
In this area of shapes unit, upper graders participate in hands-on problem solving activities to find the formulas for the area of a parallelogram, a triangle, and a trapezoid. They manipulate the geoboard to explore relationships among...
Scholastic
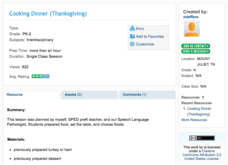
Cooking Dinner (Thanksgiving)
American traditions of Thanksgiving come to life through culinary activities. Young chefs practice cooking a turkey and setting a table for a Thanksgiving family feast. They use math and reading skills to follow directions and measure...
Curated OER
Angle Relationships
Learners investigate geometric relationship using conjecture about linear pairs and vertical angles. In this geometry lesson, students apply their theorems and previous geometry knowledge to solve for and find angles of linear...
Curated OER
What is Air?
Young scholars investigate air by participating in a class experiment. In this matter measurement lesson, students identify air as a gas which consists of mass. Young scholars utilize a windsock or balloon to measure oxygen and explore...
Curated OER
Area, Perimeter and Rations Using Pentominoes
Learners of all ages investigate area and perimeter through pentominoes. In this geometry lesson, students calculate the are and perimeter of different geometric shapes and describe the properties of similar and congruent shapes. This...
Arizona State University
Tricorn Triangles
Help your learners examine triangles. Pupils explore the different sizes and measurements of triangles. They discover triangles can be isosceles or scalene, and examine the attributes of triangles. Here is the website where you can...
American Statistical Association
Step into Statastics
Class members study the size of classmates' feet and perform a statistical analysis of their data. They solve for central tendencies, quartiles, and spread for the entire group as well as subgroups. They then write a conclusion based on...
Curated OER
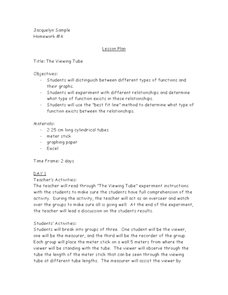
The Viewing Tube
Looking for an excellent instructional activity that incorporates math, science, and technology? Groups of three learners use a viewing tube to perform an experiment, and discover how to organize their data into an Excel...
Utah Education Network (UEN)
Linear Graphs Using Proportions and Rates
Using a TI-73 or other similar graphing calculator middle school math majors investigate the linear relationship of equivalent proportions. After a brief introduction by the teacher, class members participate in a timed pair share...
Curated OER
Weather instruments
Students explore weather instruments. In this weather lesson, students make rain gauges, anemometers, and barometers following the instructions given in the lesson. Students set up a weather station using their instruments and record and...
Mathematics Assessment Project
Estimating Length Using Scientific Notation
Would you rather have a million dollars or 1 x 10^6 dollars? To find the answer to this question, class members first complete an assessment task converting numbers between decimal notation and scientific notation. They then take...
EngageNY
The Height and Co-Height Functions of a Ferris Wheel
Show learners the power of mathematics as they model real-life designs. Pupils graph a periodic function by comparing the degree of rotation to the height of a ferris wheel.
Curated OER
Tiling the Classroom
Students see how to identify regular polygons, how to slide, turn and flip polygons, and why certain polygons tessellate better than others. Groups create a one foot square design to be used to tile the classroom. Great lesson!
Curated OER
Branding Circles, Squares, Rectangles, Triangles
Compare and classify 2-D shapes! Kindergarteners inspect the attributes of plane shapes and examine shapes in everyday life. They label the circles, squares, rectangles, and triangles they find. This is the website where you can find the...
Curated OER
Mining Shapes
In this 2-D shapes lesson, kindergarteners review plane shapes attributes. They engage in a shape hunt in the classroom and create art using plane shapes. A good, hands-on lesson!
American Statistical Association
You and Michael
Investigate the relationship between height and arm span. Young statisticians measure the heights and arm spans of each class member and create a scatter plot using the data. They draw a line of best fit and use its slope to explain the...


