CK-12 Foundation
Stratified Random Sampling: An Extracurricular Study
Learning isn't a random process. A well-designed interactive lesson helps classes make key conclusions about stratified random sampling. They calculate group percentages and use those percentages to decide on sampling totals.
Project Maths
Introduction to e
First there was pi and now there's e. A discovery-based lesson plan helps learners find a pattern in compound interest as the compounding period changes. Their investigation results in the discovery of the number e. The lesson plan is...
Beyond Benign
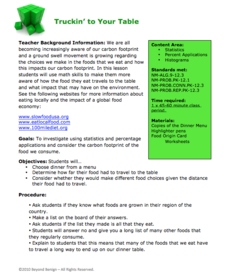
Truckin’ to Your Table
Food takes a trip to the table. Class members choose a meal from a menu and calculate the total cost of the meal including tax and tip. Using a food origin card, pupils determine how far each of the ingredients of a meal traveled to end...
Bowland
AstroZoo
Rescue animals in the zoo by applying math concepts. Groups of learners solve three missions involving oxygen, food, and climate control. Each group selects an animal from one of four bio-domes.
CK-12 Foundation
Understand and Create Stem-and-Leaf Plots: Event Survey
A good lesson doesn't just grow on trees! Help your classes understand the concept of a stem-and-leaf plot using an interactive lesson. Learners first create a stem-and-leaf plot from a set of data by dragging the values to the plot....
Willow Tree
Weighted Averages
Mixtures, weighted percentages, and varying speeds make problem solving difficult. The resource give learners a strategy for tackling these types of problems effectively.
Curated OER
The Stock Market
Students explore the loss and gain made in the stock market as they invest a sum of money and report the results as percentages instead of points.
Curated OER
Junk Food Math
Students use Skittles candies as they explore estimation and percentages. In this math lesson plan, students sort, count, and chart Skittles candies to learn about estimation and study percentages.
Curated OER
Stretching the Truth
Sixth graders visualize different percentages as parts of a whole on visual images. They observe alterations of photographs, and models of circles, squares and sets. This incredibly detailed, eight-page plan leads you through everything...
S2tem Centers SC
Investigating Chance Processes of Probability
How likely is it that the school cafeteria will serve chicken tomorrow? Discover the concept of probability with the roll of the dice. Pupils evaluate the liklihood of several statments about everyday life. Then, a mathematical...
Curated OER
Percentages
Students examine the concept of percent and calculate percentages of one hundred and convert them into fractions and decimals. They view and discuss a one hundred square grid and identify percentages. Students design a playground...
Curated OER
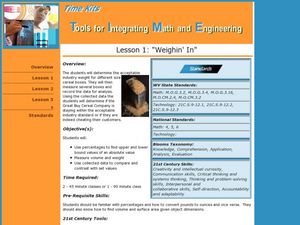
Tools for Integrating Math and Engineering: Weighin' In
Students collect and analyze data on a fictional cereal company's products. In this measurement instructional activity, students collect data from cereal boxes (weight, volume, surface area, etc.) to determine if the boxes labels...
Curated OER
Real Math
Students explore careers that require math knowledge and solve real life math problems. As a class, they compare and contrast classroom math to real life math and explore the links between algebra, geometry and math skills used in...
Curated OER
Kool Kumara Lesson Plans - Healthy Living
Students read graphs as they work with recommended daily intakes of nutrients. In this math and nutrition lesson plan, students examine Recommended Daily Intake Maps to establish how much of the daily requirement is met by eating on...
Curated OER
Motherhood Math: Mothers in the Workforce
Students evaluate a table showing how the number of working mothers increased between 1955 and 2000. They use the information from the table to complete a worksheet imbedded in this instructional activity.
Curated OER
Prime Time Math: Emergency
Eighth graders, while using Prime Time Math: Emergency software, use math and medical data to participate in the diagnosis of a girl. Just like the medical team in the story, they will be using math to respond to a medical emergency- a...
EngageNY
Changing Scales
Pupils determine scale factors from one figure to another and the scale factor in the reverse direction. Scholars compute the percent changes between three figures.
Mathematics Assessment Project
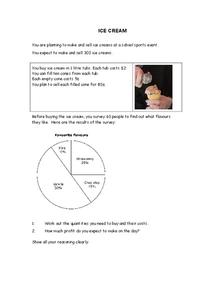
Ice Cream
I scream, you scream, we all determine the amount of ice cream! Pupils calculate the amount of ice cream flavors needed based on survey results in a short summative assessment. They determine the number of tubs and cost of ice cream to...
Curated OER
Arithmetic: Fractions and Percentages
Young mathematicians review the basic operations needed for addition and subtraction of fractions. They review the rules for addition and subtraction of fractions with the same denominator, how to change them if the denominators are...
West Contra Costa Unified School District
Interest and the Number e
Mary, Mary, quite continuously, how does your money grow? Uses examples to examine the difference between simple interest and compound interest, and to take a look at different rates of compounding. Learners explore what would happen as...
Radford University
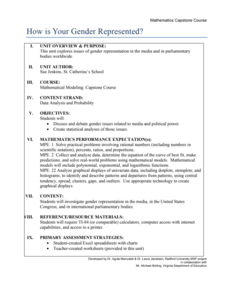
How Is Your Gender Represented?
Does the media shape people's views on gender? Scholars use data on gender portrayal in magazines to explore the idea. They use a spreadsheet program to create bar graphs and perform a chi-square test. They also use provided data to...
Curated OER
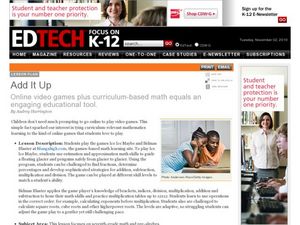
Online video games plus curriculum-based math equals an engaging educational tool.
Seventh graders use online math games to practice understanding the skill of estimation and order of operations. In this lesson, 7th graders use the internet to play online games to strengthen their understanding of these skills.
Curated OER
Closing the Salary Gap
Students explore careers in their community and compare the average salaries for men and women working in those careers. They explore a variety of careers available in their community through participating in this lesson.
Curated OER
Decimal Baseball
Young mathematicians represent recorded information in decimal form. In this decimals lesson, learners play a "classroom friendly" basketball game in which pupils take 10 shots. Number of shots made out of 10 is recorded as a fraction...


