Curated OER
Determining the Existence of Gender Bias in Daily Tasks
Help your kids explore gender bias. Learners design and conduct a survey examining role responsibilities within families. They determine the percentage of responsibilities for males vs. females and graph the results. Then they analyze...
Curated OER
It's a Sale!
Students make good decisions about making purchases of items on sale and explain how percentages effect cost.
Curated OER
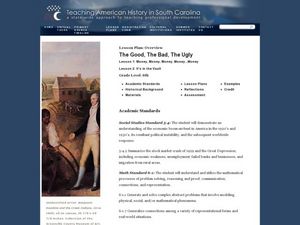
The Good, The Bad, The Ugly
Sixth graders examine the causes of the stock market crash of 1929. In this integrated math/history unit on the stock market, 6th graders study, research, and read stocks, visit a local bank, and create a PowerPoint to show the finished...
Curated OER
Scaling Down Art
Students change the scale of a work of art using ratios, percentages, and proportions. While this is technically an art instructional activity, there is quite a bit of mathematics involved in converting to the correct scale.
Curated OER
Time Management: Piece of Pie
Students examine their own lives and how well they manage their time outside of school. In this this time management lesson, students discover the amount of time they spend on other activities, and create a pie chart with that...
Curated OER
Fraction Conversion 2 (With Percents)
Fifth graders determine how to convert fractions, decimals, and percents. In this conversion instructional activity, 5th graders use an on-line applet to practice making these conversions. They review how to make the conversions in a...
Curated OER
Charts and Graphs
Fifth graders interpret data into graphs and percentages. In this organizing data instructional activity, 5th graders discuss bar, circle and line graphs. Students complete bar graph and apply probability using the results.
Curated OER
M&Ms; Line Plots and Graphing
Students, using small individual bags of M&Ms, engage in activities including; estimating, sorting, graphing, mean, median, mode, fractions, percentage, and averaging.
Curated OER
Data Management and Probability: Applications
In this data management and probability applications instructional activity, 7th graders solve 13 different types of problems that include finding the mean, median, mode, and range of each set of values, as well as, solving a number of...
Curated OER
Buy or Lease an Automobile
Students gather information on 3 new cars they would like to buy or lease, and use mathematical comparisons to decide whether to buy or lease the car.
Curated OER
Roundball for Remembrance
Students view a segment of Futures With Jaime Escalante showing the application of math in basketball, and they try to find some of these applications in a tape of a game played by their home school. This fun lesson should be very...
Curated OER
A Tough Nut to Crack
Sixth graders explore agriculture by examining world geography. For this pecan cultivation lesson, 6th graders identify the history of the famous nut and the impact it has on the U.S. economy, diet and human body. Students define...
Curated OER
Probability Experiment
Students do an experiment with probability. In this probability lesson, they listen to part of the book G is for Googol: A Math Alphabet Book by David M. Schwartz. They complete 3 probability experiments and check to see how close their...
Curated OER
Leveled Problem Solving: Circle Graphs
In this circle graphs worksheet, students solve 6 word problems based on a circle graph about the most popular classes for sixth graders. Students calculate angle measures of circles for 2 of the problems.
Curated OER
Government Goods and Services
Fifth graders investigate the connection between taxes and government services. In this economics lesson, 5th graders discuss the process and benefits of paying sales and income taxes. Using calculators, students compute the amount of...
Curated OER
Exquisite Excursions
Students locate 6 cities, one on each of the 6 major continents. They find distance for each leg of their journey, convert to percents, use a time zone map, and convert to foreign currencies.
Curated OER
Jambalaya's Restaurant
Young scholars use a menu and recipes to work on adding, subtracting, and percentages. They are given they weekly circulators, advertisements, or actual products and students practice figuring out sales tax. Young scholars figure slaes...
Curated OER
Finding the Area Under A Curve with Random Probability
Young scholars explore the concept of area under a curve. In this area under a curve lesson, students find the area under a curve using the Monte Carlo method using random points and probability. Young scholars calculate the area under...
Curated OER
Probability and Geometry
Students examine the relationship between probability and geometry to solve problems. In this geometry and probability lesson, students investigate the effect of changing percentages on a spinner to the probability of landing on a...
Curated OER
Surface Area and Measuring
Tenth graders explore volume and surface area through percentages. In this geometry lesson, 10th graders analyze the surface area of two and three dimensional shapes, then use percents and ratio to compare the two.
Curated OER
Baseball Relationships - Using Scatter Plots
Students use graphing calculators to create scatter plots of given baseball data. They also determine percentages and ratios, slope, y-intercepts, etc. all using baseball data and statistics.
Curated OER
What's in Soil?
Young scholars examine soil samples and make observations. For this soil lesson, students participate in experiments to determine the components (mineral matter, organic matter, water air) in the soil. Young scholars analyze a pie graph...
Curated OER
Money: Kids and Cash
Young scholars discuss what a bank is and what it is used for. For this mathematics lesson, students solve problems related to interest and percentages.
Curated OER
Infusing Equity in the Classroom by Gender
Students investigate the idea of gender descrimination in the classroom. For this algebra lesson, students collect data in stereotyping, and gender bias in the classroom, school materials and activities. They graph and analyze their...


