Alabama Learning Exchange
Find a Pattern Using Children's Literature
Sixth graders listen to Demi's, On Grain of Rice: A Mathematical Folktale. They use the problem solving strategy of finding a pattern to determine the number of rice Rani will receive after 30 days. They create a spreadsheet which...
Curated OER
Foliage Tracker
Young scholars discuss the change of leaf colors and the role that climate and elevation play in those changes. They then track leaf changes, input data, and graph foliage changes with a free online tool.
Curated OER
Places and Production
Learners calculate United States GDP and GDP per capita, use a choropleth map to acquire information, and create choropleth maps of GDP per capita in South America. They identify regions with high and low GDP per capita
Curated OER
Coin Carnival
Learners investigate the value of coins. In this coin value lesson, students read The Penny Pot by Stuart Murphy. Learners expand on skills learned in the book and engage in activities to determine the value of a mixed set of coins while...
Curated OER
Discriminant Testing
The class works to identify solutions using the discriminant.They use part of the quadratic formula to find the number of solutions a quadratic equation will have. They calculate how-many times the quadratic function will cut the x-axis....
Curated OER
Circles-Diameter, Circumference, Radius and the Discovery of Pi
Seventh graders measure the diameter, circumference and radius of a circle and find pi using the diameter and circumference. In this geometry lesson, 7th graders work in groups to find the diameter, radius, and circumference of circles....
Curated OER
Write Me Two Ways
Fifth graders write numbers in standard and expanded form. For this writing numbers in standard and expanded form lesson, 5th graders write integers up to billions in word form and standard form. Students use number cards to create...
Curated OER
Prize Numbers
Students explore what a proof is, how and why mathematicians create them and compose essays on how reason and logic are employed in the workplace. They explore whether any three lines can make a triangle and attempt to verify Goldbach's...
Pennsylvania Department of Education
Freckle Face
Students collect and record data. In this early data analysis lesson, students gather data about their partners face. As a class, the students use tally marks and pictographs to record the data and answer question about the information...
Curated OER
"Water is Life" Global Water Awareness
Students examine and calculate the percentage of potable water remaining on the earth. In this ecology and geography lesson plan, students brainstorm the main factors affecting water distribution. Students use mathematical problem...
Curated OER
2.0 "Water Is Life" Global Water Awareness Mini-Unit (Grades3-5)
Young scholars study the amount of potable water on the Earth. For this water lesson, students examine the amount of potable water as compared to all the water on the Earth. They discuss why many parts of the world do not have access to...
Curated OER
Percents: What's the Use
Learners research percentages in real world situations. In this percents lesson, students demonstrate their ability to apply percents to everyday situations. Learners communicate mathematically by conducting interviews about percents and...
Curated OER
Popcorn Geography
Students use kernels to create a "Top Corn-Producing States" map or graph. They read and round off numbers. Students identify on a U.S. outline map the location of corn-growing states. They create a visual (map or graph) illustration...
Curated OER
Global Statistics
Students determine statistics based on data. In this statistics lesson, students use data and record in charts. Students create graphs based on the statistics found.
Curated OER
Partial Quotients
Fifth graders examine the partial-quotients algorithm for finding the answer to a division problem. In this partial quotients lesson, 5th graders demonstrate the process of division through a series of estimations. Students examine the...
Curated OER
Touring Delmarva
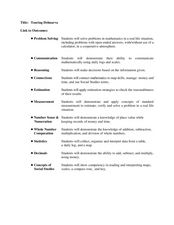
Learners plan a trip. In this trip planning lesson, students use a map to find where they would like to visit with a pretend family of 4. They get a specific amount of money and time and need to decide where they will stay and what they...
Curated OER
Decimals: Collaborative Lesson
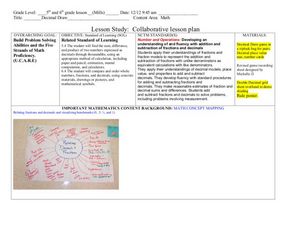
Students explore mathematics by participating in a group activity. In this number value lesson plan, students identify the uses for decimals and how to best estimate whole numbers based on decimals and fractions. Students collaborate...
Curated OER
So You Would Like a Wind Farm, Eh?
Young scholars collect and analyze data correctly. In this statistics lesson, students use central tendencies to analyze collected data. They calculate where a wind farm will be placed, based on the data.
Curated OER
Atlatl Lessons
Fifth graders study math patterns and relationships as well as learn about the heritage of Aboriginal peoples of Saskatchewan. In this patterns and heritage lesson, 5th graders research the daily lives of First Nations People in...
Curated OER
Bar Graphs
Third graders examine the main parts of a bar graph and how to round up to the nearest tenth. They make an example of a bar graph and answer questions based on the graph using a list of state capitals and their average temperatures....
Curated OER
Graphing Data on Ellis Island
Third graders use data to make a bar graph. In this graphing and social studies lesson, 3rd graders use data about where Ellis Island immigrants came from to complete a bar graph on Microsoft Excel.
Curated OER
comparison of Two Gender Sports Teams
Students gather data on sports team and create a box and whisper plot. In this data collection instructional activity, students find the median, the quartile range, and relationships between variables.
Curated OER
Battle of "The Cents"
Learners explore money. In this counting money lesson, students play a card game using the rules of "War." Learners turn over cards, determine the money value represented, and the student with the highest value keeps the cards.
Curated OER
French Fry Fun: Estimating and Measuring
Third graders demonstrate their estimating and measuring abilities. In this length measurement lesson, 3rd graders produce estimates of how long a handful of French fries will be before physically measuring them. Students graph their...


