Curated OER
Great Graphs
Students create graphs by tabulating their preferences among 10 state quarters. They examine quarters and tally their favorites. They complete a worksheet. There are more lesson plans included in this unit.
Curated OER
Solutions, Solutions, Could it Be?
Students graph and solve linear system of equations. In this algebra lesson plan, students use algebraic and graphing methods to solve their systems. They find the point of intersection for their solution and draw inference from their data.
Curated OER
Name Fame
First graders learn the uniqueness of their names by reading the book, Chrysanthemum, and completing other integrated math counting and graphing activities.
Curated OER
Sound Pictures
Students examine the components of a sonar system. In this physical science lesson students explain how multibeam and sidescan sonar systems are useful to ocean explorers. Students simulate sonar operations in an activity using a motion...
Curated OER
Virtual Field Trip / Route, Mileage and Gasoline Cost Graphs
Students use a spreadsheet program to graph and compare milage, gasoline costs and travel time for two travel routes in their virtual field trip in Michigan. They determine the most economical route based on the graphs and calculations.
Curated OER
Give It Back From a Snack Lesson 2: Invest With the Best
Students survey schoolmate as to what type of snacks they would prefer to purchase. They graph the results and apply them to planning a classroom snack sale while examining what wants, needs, and consumers are.
Curated OER
Graphing Integers On a Coordinate Plane
Seventh graders explore the concept of graphing integers on a coordinate plane. In this graphing integers on a coordinate plane instructional activity, 7th graders discuss scenarios where coordinate systems are used in real life. ...
Curated OER
Squaring a Binomial Lesson
Students practice squaring binomials. In this Algebra I instructional activity, the students use the "Square of Fun" to experience a concrete visualization of the process of squaring a binomial. The instructional activity assumes that...
Alabama Learning Exchange
Poppin' For Popcorn!
Students graph data from different popcorn flavors. In this graphing lesson, students make graphs using an assigned web site after collecting data about the flavors of popcorn that fellow classmates prefer.
Curated OER
Pick a Pet
Students construct a pictograph of favorite pets. In this pets and graphing lesson, students discuss their favorite pet and use animal magazines to find their favorite pets and cut them out. Students create a pictograph using the pictures.
Curated OER
Transforming Snoopy Using Coordinates
Students graph coordinate points to create a picture of Snoopy. In this coordinate point lesson, students read a book and learn about Rene Descartes' invention, the coordinate grid. Students graph a surprise picture on Geometer's...
Curated OER
Our Favourite Halloween Treat
Students conduct a survey about Halloween candy and create a bar graph illustrating the data. For this data analysis lesson, stud nets are introduced to the topic with a discussion and survey, then the class creates a large graph and...
Curated OER
Which Car Should I Buy?
Students use gas mileage of different cars to create T charts, algebraic equations, and graphs to show which gets better mileage. In this gas mileage lesson plan, students use the graph to see which car they should buy.
Alabama Learning Exchange
Keep It Movin'!
Learners conduct an experiment to study friction. They complete a KWL chart on friction and conduct an activity about the amount of friction on a moving object. To conclude, pupils create a table or graph of the data collected and they...
Curated OER
What Does Average Look Like?
Fifth graders explore the concepts of range, median, mode, and mean through the use of graphs drawn from models. They use manipulatives to represent data they have collected within their groups, and compare the differences between mode,...
Curated OER
Fun Wth Angles
Fourth graders explore angles in everyday life. In this angles lesson, 4th graders view examples of angles, then search magazines, newspapers and catalogues for more examples. Students work in pairs and check each other's work.
Curated OER
Functions of Algebra
Students use technology graph and evaluate linear inequalities. They write and manipulate inequalities for use on a graphing calculator. In addition they apply their skills to analyze inequalities. Answer Key included.
Curated OER
Bodacious Buttons
First graders participate in games, graphing, and probability exercises to sort and graph buttons. They sort buttons with Venn diagrams and Bull's Eye graphs.
Curated OER
A Steep Hike
Students explore slope. In this middle school mathematics lesson plan, students analyze and interpret graphs as they investigate slope as a rate of change. Students use a motion detector to collect data as they walk at different speeds...
Curated OER
I'm Warm Now
Third graders graph how much water is wasted while waiting for it to get warm in the spigot in the sink. In this graphing lesson plan, student first predict how much water is wasted. That night they test it out at home and the next day...
Curated OER
Buzzy, Buzzy Bee
Students simulate honeybees pollinating flowers. In this pollination lesson, students role-play the process of pollination over the course of several seasons. Students graph results and share their graphs with the class.
Curated OER
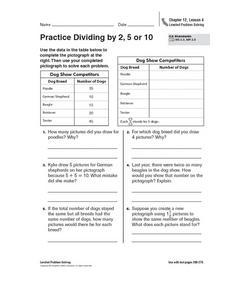
Practice Dividing by 2, 5, or 10
In this pictograph problem solving worksheet, students analyze the data on a table and create a pictograph. Students read and solve 6 story problems about the pictograph.
Curated OER
Global Statistics
Students determine statistics based on data. In this statistics lesson, students use data and record in charts. Students create graphs based on the statistics found.
Curated OER
Mixing Mixed Numbers Art/Creating Fractions
Third graders explore number values by participating in class math activities. In this fractions lesson, 3rd graders collaborate with classmates to discuss the technique of adding mix numbers while utilizing paper plates to help...


