Curated OER
Statistics and Probablility
Statistics and Probability are all about collecting, organizing, and interpreting data. Young learners use previously collected data and construct a picture graph of the data on poster board. This stellar lesson should lead to...
Federal Reserve Bank
Less Than Zero
Perry the penguin wants to buy a new scooter, but he doesn't have any funds! Walk your kids through the short book Less Than Zero, and have them track his borrowing, spending, and saving on a line graph while you read. Pupils will learn...
National Security Agency
Starting a Restaurant
Through an engaging unit, chefs-in-training will sort and classify data using tally charts. Learners will also create bar graphs to display restaurant data and interpret data from bar graphs using a variety of categories....
Shodor Education Foundation
Plop It!
Build upon and stack up data to get the complete picture. Using the applet, pupils build bar graphs. As the bar graph builds, the interactive graphically displays the mean, median, and mode. Learners finish by exploring the changes in...
Point Pleasant Beach School District
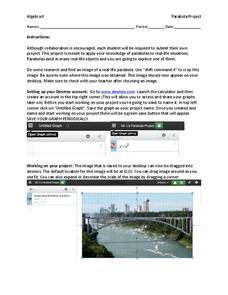
Parabola Project
Class members select a picture that contains a parabola and construct a drawing of it using function graphs in the quadratic project. Individuals restrict the domains of the functions to create a more accurate drawing. They then submit a...
Shodor Education Foundation
Multi-Function Data Flyer
Explore different types of functions using an interactive lesson. Learners enter functions and view the accompanying graphs. They can choose to show key features or adjust the scale of the graph.
Shodor Education Foundation
Linear Inequalities
An interactive lesson helps individuals learn to graph inequalities in two variables. Scholars can adjust the interactive to present the inequalities in standard or slope-intercept form.
Shodor Education Foundation
Conic Flyer
Graphing conics made easy. Individuals use an interactive to graph conic sections. The app can handle circles, vertical and horizontal parabolas, ellipses, and vertical and horizontal hyperbolas.
Shodor Education Foundation
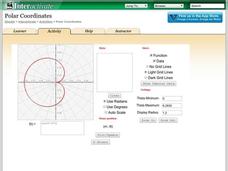
Polar Coordinates
Polar opposites might not work together—but polar coordinates do! The interactive provides learners the opportunity to graph trigonometric and algebraic functions using polar coordinates. The program takes either individual data points...
Curated OER
Activity Plan 4-5: I'm Graphing to Know You!
Learners create graphs about themselves to learn more about one another. In this early childhood math lesson, students record information about one another as they make picture graphs.
Curated OER
Graphing Memories
Mem Fox’s Wilfrid Gordon McDonald Partridge provides the labels for a graphing activity. Class members create an illustration of a memory item brought from home, and place their illustration in the proper column of a graph. When the...
Curated OER
The Night Before Christmas Graph
First graders graph their favorite The Night Before Christmas books. In this graphing lesson students listen to several versions of the the same story, The Night Before Christmas. The students each choose their favorite version and the...
Curated OER
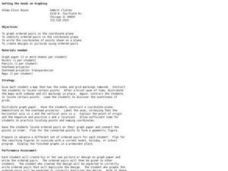
Getting the Goods on Graphing
Students explore graphing. In this math lesson plan, students graph ordered pairs in the coordinate plane, write the coordinates of points shown on a plane, and create designs or pictures using ordered pairs.
Curated OER
Graph Club 2.0 Matching
Second graders study graphing using pictographs and bar graphs. They graph pie charts, line graphs, and also change the graph scale up to 1000. They use the pictograph on the left to create the same graph on the right using a bar graph.
Shodor Education Foundation
Multiple Linear Regression
You'll have no regrets when you use the perfect lesson to teach regression! An interactive resource has individuals manipulate the slope and y-intercept of a line to match a set of data. Learners practice data sets with both positive and...
Curated OER
The Mitten
Explore the Ukraine through a reading of The Mitten. Readers will determine the sequence of events, cause and effect, make predictions, and find the main idea of the story. They also use math skills to make charts and graphs. Finally,...
Curated OER
Fast Food Survey Using Bar Graphs
Second graders create a bar graph to pictorically represent the data collected from a survey of students. They use Excel to electronically create the graphs and data tallies. They then interpret their data using sentences to explain.
Curated OER
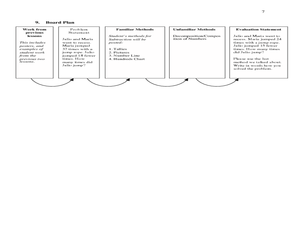
Mathematics Lesson Plan
Second graders study subtraction facts. In this mathematics lesson plan, 2nd graders discuss how to solve two digit subtraction problems. Students recognize that there are many different methods or strategies one can use such as using...
Curated OER
M & M Madness
M&M's are always a great manipulative to use when teaching math. In this graphing lesson plan, learners predict how many of each color of M & M's there are. They count up each color and plug the data into a graph using the...
Curated OER
Popping Problems!
Turn your math lesson into a carnival game with this fun, outdoor activity. After reviewing the concept your class will be practicing briefly, split your class up into teams and head outdoors. These teams work to solve math questions and...
EngageNY
Mid-Module Assessment Task: Grade 7 Mathematics Module 3
Lesson 16 in the series of 28 is a mid-module assessment. Learners simplify expressions, write and solve equations, and write and solve inequalities. Most questions begin as word problems adding a critical thinking component to the...
Curated OER
Buying on Credit
Explore using credit in this financial responsibility and math lesson plan. Learn to identify the acronym of "PRT" as Principle x Rate x Time, then calculate interest based on this formula. Do some real-world problem solving and choose...
Curated OER
Gummy Bear Picture Graph
First graders investigate picture graphs. In this graphing lesson, 1st graders create a picture graph with the x-axis being number and the y-axis being color. Students sort their gummy bears by color and use pictures of colored bears...
Curated OER
Gummy Bear Math
First graders predict, collect data, and create a graph based on gummy bear colors they are given. In this graphing lesson plan, 1st graders first predict how many colors of gummy bears there are. They then count the colors, graph them,...


