Curated OER
Graphing Using Cookies
Students differentiate between bar graphs, line graphs, pictographs and bar graphs. After participating in a hands-on cookie activity, students label and draw their own graphs.
Curated OER
Creating Line Graphs
Learners draw line graphs. For this math lesson, students interpret minimum wage data and graph the data in a line graph. Learners predict the next minimum wage and figure the earnings for a 40 hour work week for someone earning the...
Curated OER
Circle Graphs
Sixth graders participate in a lesson that covers the reading and interpretation of a circle graph. They review the part of a whole concept for percents and student observe and practice using the circle graph.
Texas Instruments
TI-Nspire™ CAS
When it comes to rating educational calculators, this calculator is always near the top of this list. Now it's available as an app. There is a lot of calculator power wrapped up in this app. Not only is this a fully functioning...
Texas Instruments
TI-Nspire™
We landed on the moon with less computing capabilities than you can find in this app! Here is a multiple function calculator that takes all the power you get from a handheld and adds the wonderful large screen that only a tablet can...
Texas Instruments
Let's Play Ball with Families of Graphs
Learners explore quadratic equations in this Algebra II lesson. They investigate families of quadratic functions by graphing the parent function and family members on the same graph. Additionally, they write the equation of the parabola...
Curated OER
Geometry: Helix-a-Graph
Students use geometry to create art. In this geometric graphing and patterns instructional activity, students create a helix-a-graph by plotting points on a grid that follow a certain pattern and analyze the drawing they created.
Curated OER
A Reading Graph
Students construct and interpret a "favorite classroom books" graph. In this literacy and math graphing lesson, students choose a reduced size copy of the book cover that corresponds with the book(s) they chose to read during their...
Curated OER
Hassan's Pictures - Linear Programming and Profit Lines
Students graph systems of linear inequalities. In this linear programming and profit lesson, students explore linear programming problems. They graph a feasible region in a linear programming problem and identify the profit lines. ...
Curated OER
Shell Graphing
Fifth graders explore the four quadrants of a coordinate grid. In this graphing lesson plan, 5th graders trace sea shells in each of the four quadrants of a coordinate grid and then label the ordered pairs on each shell. For the final...
Curated OER
Math: Skyscraper Comparison
Students examine skyscrapers by conducting Internet research and by creating and interpreting graphs. After reading the book, "Skyscraper," they discuss reasons why the structures are built. Once they have researched the tallest...
Curated OER
Applied Science - Science and Math Post-Lab
Students explore optical illusions. In this Applied Science lesson, students view optical illusions and record the data of what they see. Students graph the data that they collect.
Curated OER
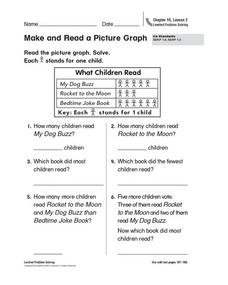
Make and Read a Picture Graph
What books do you like? Have your learners read and interpret a picture graph detailing a fictional class's favorite books. Consider conducting a survey of your learners' favorite books and plotting the results as a class!
Beyond Benign
The Big Melt: Arctic Ice Caps
Are the Arctic ice caps really melting out of existence? Junior climatologists examine the statistics of ice decline through four math-based lessons. Each activity incorporates data, climate information, and environmental impact into an...
CK-12 Foundation
Quadratic Functions and Equations
The form of a quadratic function paints a picture of its graph. Young mathematicians explore this connection by locating key features on a graph and then writing the corresponding equations. The interactive tutorial highlights key...
Curated OER
Sorting and Graphing Animals
Students inquire about animals using SIRS Discoverer or eLibrary Elementary. In this organizing data lesson, students sort pictures of animals in various ways and develop graphs. Students locate a mammal, reptile, fish, insect or bird...
Curated OER
Gingerbread Man Math
Students collect and explore gingerbread man data. In this math and technology lesson plan, students examine how to organize and interpret data in three formats: objects, pictures, and graphs.
Curated OER
Just Graph It!
Students practice collecting data and organizing it into graphs. As a class, they collect birthday information from each of their classmates. To continue practicing, they examine the characteristics of different bugs and zoo animals. ...
Curated OER
Lines in the Coordinate Plane
Students graph lines in a coordinate plane. In this geometry activity, students graph lines on a coordinate plane, and identify the slope. They classify the lines as parallel or perpendicular and write an equation of a given line.
Curated OER
Writing equations for the picture project
Students write equations for their graphs. In this algebra lesson, students analyze graphs after they plot them using coordinate points and write an equation for the line given the slope and y-intercept. They express their answers using...
Curated OER
Interpreting and Displaying Sets of Data
Students explore the concept of interpreting data. In this interpreting data lesson, students make a line plot of themselves according to the number of cubes they can hold in their hand. Students create their own data to graph and...
Curated OER
Perplexing Puzzles
Elementary and middle schoolers explore scatter plots. In this graphing activity, pupils work in small groups and use jigsaw puzzles to develop a scatter plot. Younger students may develop a bar graph.
Curated OER
Maps and Modes, Finding a Mean Home on the Range
Fifth graders investigate data from maps to solve problems. In this data lesson, 5th graders study maps and collect data from each map. Students present their data in a variety of ways and calculate the mode, mean, median, and range.


