Curated OER
Jellybean Graphs
Second graders predict and graph data based on the color of jelly beans they think are in a handful. In this prediction lesson plan, 2nd graders will predict how many of each color jellybean are in a handful. Then they graph these...
Curated OER
Fishing for Points
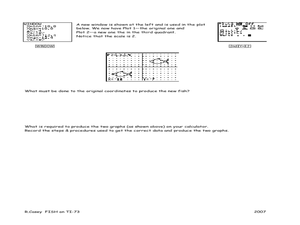
Learners explore the concept of ordered pairs. In this ordered pairs lesson, pupils list the ordered pairs of a graph in the shape of a fish. They use their calculator to translate the fish using lists, then translate the fish left,...
Curated OER
Fun With Graphs
Students create a hands-on graph then complement this by making a computerized version of the same graph using Graph Club. They read various graphs, so as to be more prepared for state exams which require this concept.
Curated OER
Coin Tossing and Graphing
Fifth graders use technology as assistance to collecting random data. Through the random data they will be able to explain the significance of getting a head or tail depending on what was previously landed on. They will then analyze the...
Curated OER
Grids
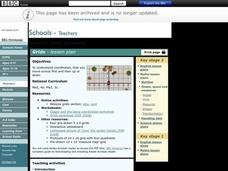
Take your study of coordinates online! Groups of learners complete an online graphing introduction, plotting the points of virtual objects. A worksheet is included for extra practice.
Curated OER
How Do You Like Your Eggs?
First graders conduct a poll about how people like their eggs. In this graphing lesson plan, 1st graders collect data about how they like their eggs. Students use a picture of themselves to place under the type of egg they like. Students...
Curated OER
M & M Madness
Students work with the mathematics unit of collection, organization, and presentation of data. In this math and technology lesson plan, students use Valentine M & M’s and The Graph Club to sort and graph the various colored M & M’s.
Curated OER
Numbers and Me
Students collect and graph data about themselves. In this collecting and graphing data lesson plan, students poll their classmates about how many siblings they have or they measure their height. Students make a bar graph of their data....
Curated OER
Creating Circles
Learners make a circle graph. In this graphing lesson, the teacher conducts a class survey, then demonstrates how to make a pie graph. When students are comfortable with the material, they use a worksheet to create their own graph.
Curated OER
Graphs of Functions
In this using function tables to problem solve learning exercise, students interpret and complete function tables to solve problems. Students solve six word problems.
Curated OER
Rooster's Off To See the World Number-Sense
Students recognize how numbers are used in number stories. For this Rooster's Off To See the World lesson, students participate in the story. Students complete a number activity and work on the computer to illustrate a number story. ...
Curated OER
Swimmy's Friends
Students solve problems using various strategies. For this problem solving lesson, students read the book Swimmy by Leo Lionni. Students make fish swimming patterns, measure how many goldfish crackers it takes to make a handprint and...
Curated OER
Equivalent Fractions Manipulatives
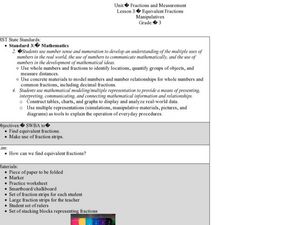
Students study fractions. In this equivalent fractions lesson, students utilize fraction strips to enhance their understanding of equivalent fractions. They watch a demonstration and then work independently with their own set of fraction...
Curated OER
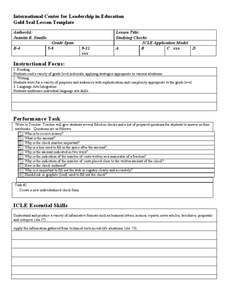
Studying Checks
While on-line banking and electronic payments seem to be the way of the future, next-generation wage earners still need to understand the details of check writing. Here the focus is on the details of the check including what the...
Curated OER
Just Graph It!
Fourth graders evaluate various graphs for the best way to reflect statistical data. They use a spreadsheet to organize data and generate varied graphic representations. They select the graph they feel best shows their results.
Curated OER
Graphing Data
Second graders examine how to make and read bar graphs. In this bar graph lesson, 2nd graders compare bar graphs to pictographs by looking at hair color survey data. They practice making a bar graph and finding the range of the data.
Curated OER
Graphing with the Five Senses
Students collect data and record it on a bar graph. In this data graphing lesson, each small group of students is assigned to collect data on one of the five senses. They then practice a song that helps them remember the purpose of each...
Curated OER
Graph and Compare the Adventure's Temperature Vs. Local Temperature
Students explore the concept graphing data. In this graphing data lesson, students use weather data from their local weather and some other city and graph them. Students plot the local weather vs. another city. Students record...
Noyce Foundation
Time to Get Clean
It's assessment time! Determine your young mathematicians' understanding of elapsed time with this brief, five-question quiz.
EngageNY
The Opposite of a Number
It's opposite day! The fourth installment of a 21-part module teaches scholars about opposites of integers and of zero. Number lines and real-world situations provide an entry point to this topic.
EngageNY
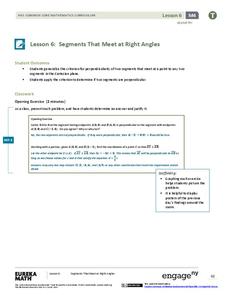
Segments That Meet at Right Angles
Can segments be considered perpendicular if they don't intersect? Learners look at nonintersecting segments on the coordinate plane and make conclusions about the lines that contain those segments. They determine if they are...
Curated OER
Intuitive Approach to Limits
Students identify and comprehend the concept of limit in mathematics. They also view artistic works illustrating limits by M. C. Escher and apply techniques of one-sided limits to graphs of relations. Finally, students compute limits...
Ms. Amber Nakamura's Mathematics Website
Algebra Project
What would your dream house look like? A cottage? A medieval castle? High schoolers enrolled in Algebra design the perfect house while using slopes to write equations for various aspects of the project.
Curated OER
Fast Food Survey Using Bar Graphs
Second graders conduct survey and sort data according to categories, construct bar graph with intervals of 1, and write a few sentences about their graphs.


