Curated OER
FOOTSTEPS IN TIME
Students measure and correlate their foot lengths and body heights, then use this data to estimate height of Laetoli hominids. They use metric measurement and graphing to determine these heights.
Curated OER
Prime Time
Seventh graders practice determining the prime factorization of composite numbers. They create Christmas factor trees for prime numbers greater than 100. They decorate their final products with markers, crayons, colored pencils, glitter...
Curated OER
Algebra I: Graphing - Lesson Plan
Twelfth graders graph ordered pairs on a coordinate plane.
Curated OER
Teddy Bears Everywhere
Students explore the history of teddy bears. In this comprehension lesson, students bring a bear of their own to compare and contrast with their classmates. Students read book and discuss the events and draw pictures of the scenes.
Curated OER
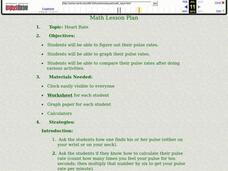
Graphing Heart Rates
Students take their pulse rates. In this graphing lesson, students take their pulse rates and graph them. Students do various physical activities and graph the differences in their pulse rates.
Curated OER
Rounding Decimals
Fourth graders explore rounding a price given in dollar and cents to the nearest dollar. In this math instructional activity, 4th graders discover how to round to the nearest dollar. Additionally, students practice rounding money for...
Curated OER
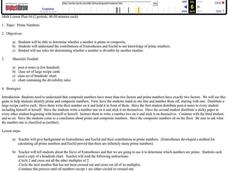
Prime Numbers
Students differentiate between prime and composite numbers. In this algebra instructional activity, students define the terminology and investigate the contributions made by Eratosthenes and Euclid as it relates to prime numbers....
Curated OER
Alfy plays "Time Flies"
Third graders use the Internet to go to a math web site to explore, practice and play time telling exercises. They play a time game by moving the clock arms to match a time presented on a button.
Curated OER
Seein' Double, Seein' Double
By using the Internet, hands-on activities, video, and cooperative learning, pupils look into the conditions in which light casts shadows on objects. The lesson includes fabulous hands-on activities, art projects, worksheets, and reource...
Curated OER
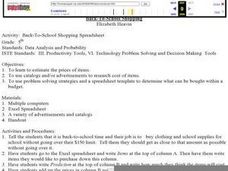
Back-To-School Shopping
Fifth graders estimate the prices of items to be bought for back to school. They use catalogs and/or advertisements to research the cost of each of the items. They use problem solving strategies and a spreadsheet template to determine...
Curated OER
Interdisciplinary Lesson Plan- Math
Students perform locomotor movement. In this locomotor skills lesson plan, students practice running, hopping, skipping, and walking then form themselves into groups based on a number called out. Students identify if more or less...
Curated OER
"Math Curse" by Jon Scieszka
Students explain everyday uses of numbers and relationships of numbers.
Curated OER
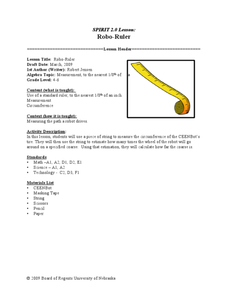
Robo Ruler
Students calculate measurements using different units and fractions. In this algebra instructional activity, students measure the path that a robot drives. They use a piece of sting to do their measurement and calculate the circumference...
Curated OER
Shut it Off!
Students identify the central tendencies. In this statistics lesson, students find the mean, median and mode of their collected data. They explain the effect of outliers on the data.
Curated OER
Graphing Data Brings Understanding
Students collect, graph and analyze data. In this statistics lesson, students use circle, pie, bar and lines to represent data. They analyze the data and make predictions bases on the scatter plots created.
Curated OER
Applied Science-Science and Math Lab
Students explore magnification. In this scientific observation skills lesson, students observe sea life items and draw pictures of what they observe. Students predict which lens will have the strongest magnification when given three...
Curated OER
Signs and Symbols
Sixth graders carefully analyze a triptych of the nativity, paying close attention to the lines, shapes and symbols included in the artwork. They explore the role of the Catholic church in society at the time the piece was created and...
Curated OER
M&M Counting Chart
Students practice classifying objects while utilizing candy. In this sorting lesson, students observe an assortment of M&M's and analyze the candy based on color. Students create a color chart based on the number of different colored...
Curated OER
Graphing
Students investigate graphing. In this bar graph lesson, students view an informational website about graphing, then construct a class birthday bar graph outside with sidewalk chalk. Students choose a survey topic, then collect data and...
Curated OER
Free Standing Structures
Learners investigate how to create a free standing structure. In this mathematics lesson, small groups of students demonstate how to build the tallest structure while spending the least amount of money on materials.
Curated OER
Probability
Second graders experiment with probability. For this probability lesson, 2nd graders pick colored beans from a bag to find the chance of getting different colors. They make fair and unfair spinners and record the data after spinning them.
Curated OER
Everyday Objects with Shapes
Students explore geometric shapes. In this geometry and language development lesson, students take a walk and look for shapes in the objects outdoors. Students match each of four individual paper shapes they are carrying with the...
Curated OER
Step Into My Shoes
Students order their classmates from smallest to largest foot length. In this ordering their classmates from smallest to largest foot length lesson plan, students trace each of their classmates foot. Students read a story called, 'How...
Curated OER
Survey and Tally
Second graders view a model of a survey and tally. In this survey and tally lesson plan, 2nd graders decide on questions for a survey. Students conduct the survey and tally their results. Students create a tally chart. Students view a...


