Curated OER
Elapsed Time Two
Students study how to calculate elapsed time. In this elapsed time lesson, they determine how to calculate the ending time of an event when they are given the starting time and the elapsed time. They participate in direct instruction,...
Curated OER
Figuring Elapsed Time
Learners tell time. For this elapsed time lesson, students review how to tell time to five minutes. Learners solve problems where they must determine the elapsed time.
Curated OER
Telling Time
Students identify numerals on a clock and put them in correct order. They identify the hour and minute hands on a clock. Students practice time skills by telling time by the hour using a standard clock.
Curated OER
How to Tell Time to the Hour
Students discover how to tell time. In this telling time lesson, students examine the parts of analog clocks and then use an activity page to make their own paper clocks. Students practice telling time to the hour using the clocks.
Curated OER
Basic Units of Time
Students review fundamental concepts of time such as A.M. and P.M. and learn about elapsed time. In this Unit of Time lesson, students review the basics of how to tell time and then are given examples to figure out how much time has...
Curated OER
How to Calculate Time
Students complete a worksheet. In this calculations lesson, students learn factual information about computing time with clocks, calendars and eras. Students show their knowledge by completing a worksheet.
EngageNY
Increasing and Decreasing Functions 2
Explore linear and nonlinear models to help your class build their function skills. In a continuation of the previous lesson, learners continue to analyze and sketch functions that model real-world situations. They progress from linear...
Armory Center for the Arts
Place Value Collage
How can art represent math? Use a lesson plan on place value collages to illustrate the different meanings that numbers have in their designated places. Kids observe photographs and paintings that show place value, then work on their own.
EngageNY
Solving Basic One-Variable Quadratic Equations
Help pupils to determine whether using square roots is the method of choice when solving quadratic equations by presenting a lesson that begins with a dropped object example and asks for a solution. This introduction to solving by...
EngageNY
Comparing Quadratic, Square Root, and Cube Root Functions Represented in Different Ways
Need a real scenario to compare functions? This instructional activity has it all! Through application, individuals model using different types of functions. They analyze each in terms of the context using the key features of the...
Curated OER
1, 2, 3 o' Clock Rock
Second graders identify the hour and minute hands. They tell time by the hour, nearest quarter hour, half hour, and determine the relationships of time (e.g. minutes in hour, days in a month, weeks in a year). They create over-sized...
Texas Instruments
Drawing a Line Tangent to a Circle
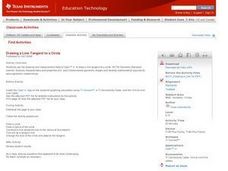
Explore lines tangent to a circle. In this math lesson plan, high schoolers manipulate circles and lines on a TI calculator. They draw a circle and analyze perpendicular lines intersecting the circle in only one place. This...
Curated OER
Converting Between Units
Upper graders practice using measurements by solving conversion problems. There are given different time or measurement increments and must convert them to a larger or smaller increment. They also utilize a calculator and conversion...
Curated OER
Dragonfly
The speed of a dragonfly brings math into the real world as your learners collaboratively see the value in calculating unit rates in direct proportion problems. This six-phase instructional activity encourages you, as the teacher, to...
EngageNY
Ferris Wheels—Using Trigonometric Functions to Model Cyclical Behavior
Have class members going in circles as they model the path of a Ferris Wheel using trigonometric functions. Building on the previous lesson in this series on transformations, learners use trigonometric functions to model wheels of...
Curated OER
Time That Period
Physical science starters play with a pendulum in order to experience periodicity. Detailed procedures and a worksheet are included for day one. For day two, learners will use a graphing calculator to help them plot orbit data from a...
Math Solutions
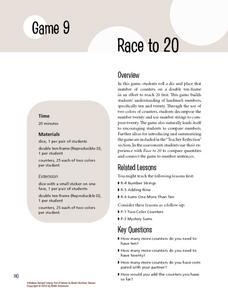
Race to 20
And they're off! Working in pairs, young mathematicians roll dice to see who can fill in their double ten-frames first. When young scholars finally fill in their arrays, they create addition number sentences that represent their rolls,...
Curated OER
Chances Are......You're Right
Young mathematicians study probability. In this math lesson, learners calculate odds, and convert those into percentages of probability. Fractions are also used, making this lesson quite rich in some of the more difficult conversions...
Curated OER
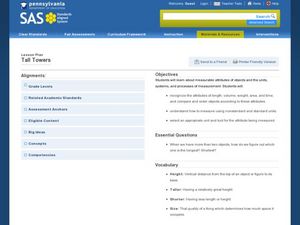
Tall Towers
Linear measurement is the focus of this math lesson. Youngsters work in groups to build towers with blocks. They build towers represented on index cards and determine how many blocks taller one tower is.
Curated OER
Buying on Credit
Explore using credit in this financial responsibility and math lesson. Learn to identify the acronym of "PRT" as Principle x Rate x Time, then calculate interest based on this formula. Do some real-world problem solving and choose...
Curated OER
Cutting Expenses
Students explore budgeting. In this finance and math instructional activity, students brainstorm ways in which households could save money. Students view websites that give cost reducing ideas. Students complete an expense comparison...
Curated OER
Linear Programming
Students explore inequalities to determine the optimal solution to maximize a profit for a company. In this linear programming lesson, students discover how to graph inequalities and how to determine the algebraic representation of a...
Statistics Education Web
Text Messaging is Time Consuming! What Gives?
The more you text, the less you study. Have classes test this hypothesis or another question related to text messages. Using real data, learners use technology to create a scatter plot and calculate a regression line. They create a dot...


