Code.org
Creating Functions
Quit repeating yourself ... you can make this simpler! Rather than repeating the same set of code over and over, class members learn to build and call functions in a series of challenges in App Lab. In the end, they combine functions to...
Teach Engineering
What Does Light See?
The second installment of a seven-part series focuses on the refraction of light and how it affects the colors we see. Learners consider how this concept connects to biosensors for cancer detection.
Curated OER
Trigonometric Identities
Learners calculate the six trigonometric identities. In this algebra lesson, students verify other identities using the basic trigonometric identities of sine, cosine and tangent. They complete a worksheet with hints and then are graded...
Curated OER
Triangle Sums
Fourth graders determine a way to place numbers in the nine circles that are arranged in a triangular pattern so that each side has an equal sum. They use each number once and practice adding single digit numbers.
Curated OER
Four Color Map
Learners explore geometry by completing a color puzzle. In this shape identification lesson, students utilize deductive reasoning to complete a Google SketchUp puzzle with trapezoid, triangles and rectangular shapes. Learners complete...
Curated OER
Factoring Trinomials
Students factor trinomials and other quadratic functions. In this algebra activity, students solve trinomials containing negative and positive coefficients. They factor quadratics of difference squares as well as regular polynomials.
Curated OER
Square Foot Garden
Students plant a garden and keep track of it. In this geometrical garden lesson plan, students collect data from their garden twice a week. They graph their finding and figure out how many square feet of growing space each person needs...
Curated OER
Water Treatment Plant Tour
Students define vocabulary related to geometry and calculate the volume. In this geometry lesson, students calculate flow rates, and volume as it relates to a water plant facility. They calculate the volume of three dimensional shapes...
Curated OER
Fast Food Survey Using Bar Graphs
Second graders create a bar graph to pictorically represent the data collected from a survey of students. They use Excel to electronically create the graphs and data tallies. They then interpret their data using sentences to explain.
Curated OER
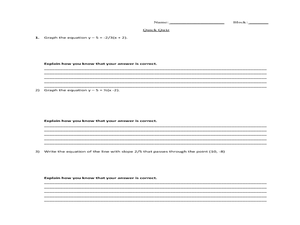
Graphing Linear Equations
Ninth graders review the information that they have already learned
with regard to linear equations and graphical representations. They then assist in combining equations with a graphical element and complete various graphs with this...
Curated OER
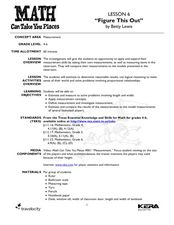
Figure This Out
Students measure different parts of the human body. In this measurement lesson, students work in pairs to take measurements of human measurements which include: arm span, height, foot length, and wrist to longest finger. They also...
Curated OER
Quadrilateral Explorations
Ninth graders identify quadrilaterals and label the vertices of quadrilaterals. they justify their identification of the quadrilaterals. Students work in groups to identify and create quadrilaterals
Curated OER
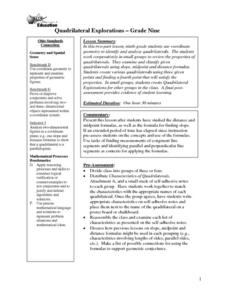
Quadrilateral Explorations-Grade Nine
Ninth graders investigate quadrilaterals. In this geometry lesson, 9th graders examine and classify quadrilaterals using the slope, midpoint and distance formulas. Additionally, students create various quadrilaterals given three point...
Curated OER
Slope, slope-Intercept Form and Standard Form
Students investigate and solve linear equations using slopes. In this algebra lesson, students graph lines using the slope and y intercept. They also find the slope by rewriting their equation in to slope-intercept form from standard form.
Curated OER
The Very Grouchy Ladybug: Telling Time
Students practice telling time by reading a children's story. In this time keeping lesson, students read the book The Very Grouchy Ladybug by Eric Carl, and create a schedule for the ladybug to complete certain activities. Students...
Curated OER
Exquisite Excursions
Students locate 6 cities, one on each of the 6 major continents. They find distance for each leg of their journey, convert to percents, use a time zone map, and convert to foreign currencies.
Curated OER
Quandaries, Quagmires, and Quadrilaterals
Students classify, flip, slide, and turn a quantity of quadrilaterals.
Curated OER
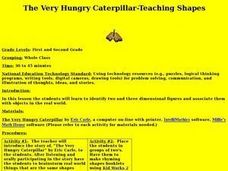
The Very Hungry Caterpillar - Teaching Shapes
Students identify two- and three-dimensional figures and associate them with real-world objects. In this geometry lesson, students are read The Very Hungry Caterpillar by Eric Carle and complete several activities including a chart of...
Curated OER
Fashion Sense and Dollar Wise
Students find the cost of an outfit. In this percentages lesson, students look at ads, pick out an outfit, and find the sale price. They create a commercial and complete 4 included worksheets.
Curated OER
Rep Tiles
Third graders use pattern blocks of one shape at a time to try to create a similar shape. They compare the perimeter of the new figure with the perimeter of the original shape and look for a pattern. Students use the pattern to predict...
Curated OER
Pythagorean Theorem Spreadsheet
Studetns use a spreadsheet to organize data on the sides of a triangle. They use the Pythagorean Theorem and the If then spreadsheet function to decide whether the three sides determine a right triangle. Middle schoolers work...
Curated OER
How many isosceles triangles can you find?
Seventh graders recognize the characteristics of isosceles triangles. In this isosceles triangle lesson, 7th graders use geoboards to create isosceles triangles. Students record results and explain why they have an isosceles triangle.
Curated OER
Solving Systems of Equations
Young scholars identify the quadrants and axis of a coordinate plane. In this algebra lesson, students discover the ocrrect way to graph using the coordinate plane. They discuss the relationship between x and y values, domain and range...


