Curated OER
Area of Tangram Pieces
Mathematicians calculate the area of a tangram piece without using formulas. They use a geometry journal to record activities during this lesson. They make a set of tangrams and use them to compute area. They use what they discover to...
Statistics Education Web
Now You SeeIt, Now You Don't: Using SeeIt to Compare Stacked Dotplots to Boxplots
How does your data stack up? A hands-on activity asks pupils to collect a set of data by measuring their right-hand reach. Your classes then analyze their data using a free online software program and make conclusions as to the...
Scholastic
Cooking Dinner (Thanksgiving)
American traditions of Thanksgiving come to life through culinary activities. Young chefs practice cooking a turkey and setting a table for a Thanksgiving family feast. They use math and reading skills to follow directions and measure...
Curated OER
Area, Perimeter and Rations Using Pentominoes
Learners of all ages investigate area and perimeter through pentominoes. In this geometry lesson, young scholars calculate the are and perimeter of different geometric shapes and describe the properties of similar and congruent shapes....
Arizona State University
Tricorn Triangles
Help your learners examine triangles. Pupils explore the different sizes and measurements of triangles. They discover triangles can be isosceles or scalene, and examine the attributes of triangles. Here is the website where you can find...
Curated OER
Exploring Scale And Ratio
Students measure the actual size and distance of the solar system using scale and ratio. They watch and discuss a video, create a distance-scale solar system model, and compare the scale sizes of planets to their actual sizes.
Curated OER
Proportionality Using Labyrinths and Mazes
Conduct research on the Internet about labyrinths and mazes to learn about proportions and ratios. Inquisitive minds design their own maze, one maze is chosen and proportionately enlarged to 20 feet by 30 feet. This is a fun challenge...
Curated OER
TE Activity: Bubbling Plants
Students study a way to quantify the process of photosynthesis during a given time using the Elodea plant. They design a hypothesis that they test in the hands on activity. They compare the amounts of photosynthesis that occur during low...
Curated OER
An Introduction To Volume
Upper graders explore the topic of volume. In this math lesson plan, pupils count volume in cubic units, multiply to find volume, estimate volume, write a multiplication sentence to find the volume, and make a cost analysis of different...
Curated OER
Angle Relationships
Students investigate geometric relationship using conjecture about linear pairs and vertical angles. In this geometry lesson, students apply their theorems and previous geometry knowledge to solve for and find angles of linear pairs....
Curated OER
Geometric Properties
Students find triangular angles using the angle theorem. For this geometry lesson, students describe labeled triangles, use the pythagorean theorem, and rewrite information about triangles in standard form.
Curated OER
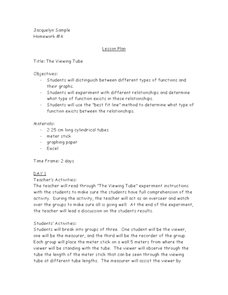
The Viewing Tube
Looking for an excellent lesson that incorporates math, science, and technology? Groups of three students use a viewing tube to perform an experiment, and discover how to organize their data into an Excel spreadsheet. This is a very...
Utah Education Network (UEN)
Linear Graphs Using Proportions and Rates
Using a TI-73 or other similar graphing calculator middle school math majors investigate the linear relationship of equivalent proportions. After a brief introduction by the teacher, class members participate in a timed pair share...
American Statistical Association
You and Michael
Investigate the relationship between height and arm span. Young statisticians measure the heights and arm spans of each class member and create a scatter plot using the data. They draw a line of best fit and use its slope to explain the...
Willow Tree
Extremes, Range, and Quartiles
The middle of the data is important, but what about the rest of it? The lesson shows learners the importance of the range, quartiles, and extreme values. Pupils practice finding each of these values from given data sets.
EngageNY
The Height and Co-Height Functions of a Ferris Wheel
Show learners the power of mathematics as they model real-life designs. Pupils graph a periodic function by comparing the degree of rotation to the height of a ferris wheel.
Curated OER
Weather instruments
Students explore weather instruments. In this weather lesson, students make rain gauges, anemometers, and barometers following the instructions given in the lesson. Students set up a weather station using their instruments and record and...
Curated OER
Branding Circles, Squares, Rectangles, Triangles
Compare and classify 2-D shapes! Kindergarteners inspect the attributes of plane shapes and examine shapes in everyday life. They label the circles, squares, rectangles, and triangles they find. This is the website where you can find the...
Mathematics Assessment Project
Estimating Length Using Scientific Notation
Would you rather have a million dollars or 1 x 10^6 dollars? To find the answer to this question, class members first complete an assessment task converting numbers between decimal notation and scientific notation. They then take part in...
Teach Engineering
Viscous Fluids
Elasticity and viscosity. Help your class understand the similarities and differences with an introduction to viscous fluids. After describing four types of fluid behaviors: shear thinning, shear thickening, Bringham plastic, and...
Alabama Learning Exchange
What You Know About the Bermuda Triangle?
Get lost in the classifications. Using the backdrop of the Bermuda Triangle, pupils classify it by angle and side measures. They also learn information about the triangle and its history.
Curated OER
Tiling the Classroom
Students see how to identify regular polygons, how to slide, turn and flip polygons, and why certain polygons tessellate better than others. Groups create a one foot square design to be used to tile the classroom. Great instructional...
Curated OER
Mapping the Bone Field: An Area and Scale Exercise
Here is an excellent cross-curricular lesson. Learners relate multiplication to area by making a grid on graph paper, and then creating the same grid in real space outside in the school yard.
Texas Instruments
Finding Linear Models Part III
Explore linear functions! In this Algebra I lesson, mathematicians graph data in a scatter plot and use a graphing calculator to find a linear regression and/or a median-median line. They use the model to make predictions.


