Curated OER
Looking at Data
Third graders use two days to create, collect, display and analyze data. Classroom activities and practice build greater understanding to a variety of forms used to display data.
Curated OER
Descriptive Statistics
Students demonstrate how to use frequency and scatter diagrams. For this statistics lesson, students are introduced to different techniques of representing data. Students sort and graph data on a worksheet and use a frequency diagram to...
Curated OER
What's Your Temperature?
Learners take a look at the local newspaper and focus on the weather section. They get into small groups, and each one looks at the same map, but of a different part of the country. They must prepare a presentation that shows how...
Curated OER
Beary O'Mometer Learns About Careers In Meteorology
Students explore the field of meteorology. In this meteorology lesson, students explore weather-related careers as they research the field of study as well as various weather concepts. Students interview meteorologists, write business...
Curated OER
Mapping River Statistics
Students research different statistics to do with the Mississippi River. They answer questions about finding data and collect it by conducting research. The research is used to construct a data table. Then students use the table to...
Curated OER
Design Team Challenge
Students work in groups to build a robot. In this robotics lesson plan, students create an electronic robot and program it to follow directions. They create an obstacle course for the robot to follow and test its performance.
Curated OER
The Seasonal Round and The Cycle of Life
Fourth graders are introduced to the concept of the seasonal round and how folklife traditions vary from season to season. They begin charting dates of personal interest on seasonal round calendars by starting with birthdays. Students...
Curated OER
Probability: The Study of Chance
Students conduct an experiment, determine if a game is fair, and collect data. They interpret data, then display line graph. They conduct analysis of game for probability.
Curated OER
Schoolyard Bird Project
Students observe and count bird sightings around their schoolyard throughout the school year.
Curated OER
Graphing Data - Temperature
Seventh graders measure and record temperature over a given time period. They compare the recorded temperatures to the 40-year recorded normal average temperatures for the same area. Students display and interpret their findings in a graph.
Curated OER
How Far Can You Throw?
Sixth graders take a turn throwing the basketball and softball. They measure the distance in feet and inches between the starting and landing points of the balls. The recorder will record the distance each ball was thrown next to each...
Curated OER
America's Pastime
Students relate Newton's Laws of Motion to the game of baseball. They compare and contrast the materials used in baseballs that could affect their performance. They also determine how friction can be increased or decreased in a ballpark.
Curated OER
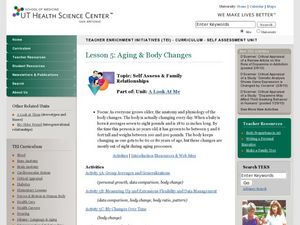
Aging & Body Changes
Learners complete several activities that have to do with aging. In this body changes lesson students take group averages, measure flexibility and see their changes over time.
Alabama Learning Exchange
Alex: The Mean, Median, and Mode Chain Gang
Cooperative learning groups and chain links are used to find the mean, median, and mode. A Science NetLinks lesson plan is linked for further real-life application in the world of baseball (optional). This lesson plan was created as a...
PBS
Pbs Learning Media: Central Tendency: Targeted Math Instruction
At the end of this instructional activity, learners will be able to recognize and apply the concepts of mean, median, and mode in real-life problems.
Alabama Learning Exchange
Alex: Estimation Station
During this lesson, young scholars will learn the difference between estimation and guessing. Knowing how to estimate is an essential skill that will help students determine approximate totals as well as check the reasonableness of their...
Alabama Learning Exchange
Alex: "Ridin' Along in My Automobile"
Students will research prices of used cars to discover how automobiles lose their value over time. Students will create a chart to record their information, use their chart to graph their data, and find measures of central tendency of...
Beacon Learning Center
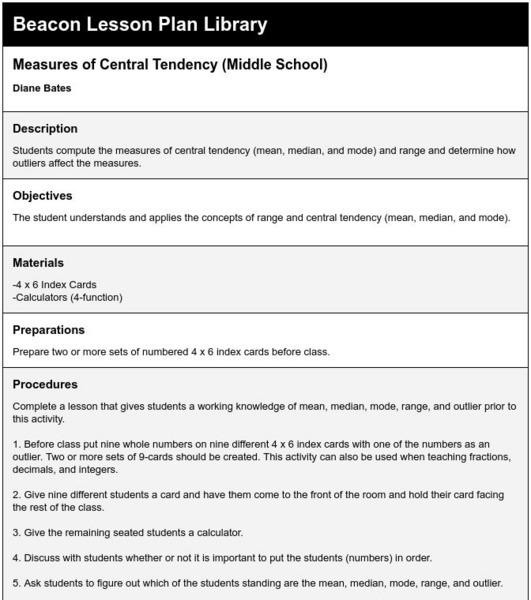
Beacon Learning Center: Measures of Central Tendency (Middle School)
Lesson plan provides practice for calculating measures of center.
Better Lesson
Better Lesson: Understanding Data!
Fourth graders will gear up to explore how to find the means, median, and modes to represent data.
Other popular searches
- Math; Mean, Median, Mode
- Math Mean Median Mode
- Math/data Mean Mode Median
- Math Ata Mean Mode Median
- Math/ Mean, Mode, Median
- Math at Mean Mode Median
- Math/ Mean Mode Median


