Curated OER
Flying High in Math
Seventh graders study how real airplanes fly and then they construct models of paper airplanes using design resources for the Internet and their own design. They use meaurement and caluculations in order to help them construct their...
Curated OER
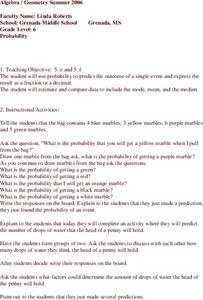
Probability
Sixth graders study the probability of single events. Given a bag of marbles, they discuss and find the probability of single events. In groups of two, 6th graders complete additional activities, predicting the probability. Students...
Curated OER
Paying for Crime
Students participate in activties examining ratios and proportions. They use graphs to interpret data showing the government's budget for prisons. They present what they have learned to the class.
Curated OER
What Can Data Tell Us?
Students explore data distribution. In this data analysis lesson, students create a data distribution table by playing the game "Tower of Hanoi" from the Hall of Science. Students analyze their data and answer data driven questions.
Curated OER
Statistics Canada
Students practice using graphing tools to make tables, bar charts, scatter graphs, and histograms, using census data. They apply the concept of measures of central tendency, examine the effects of outliers. They also write inferences and...
American Statistical Association
Tell it Like it is!
Scholars apply prior knowledge of statistics to write a conclusion. They summarize using correct academic language and tell the story of the data.
Curated OER
Raisin the Statistical Roof
Use a box of raisins to help introduce the concept of data analysis. Learners collect, analyze and display their data using a variety of methods. The included worksheet takes them through a step-by-step analysis process and graphing.
Curated OER
Interpreting and Displaying Sets of Data
Students explore the concept of interpreting data. In this interpreting data lesson, students make a line plot of themselves according to the number of cubes they can hold in their hand. Students create their own data to graph and...
Curated OER
Height versus Shoe Size
Students find a correlation between a person's height and his/her shoe size. They have access to entering data into lists on a graphing calculator and can complete scatter plots. Students read and interpret a scatter plot and use the...
Curated OER
Baseball Stats
Students explore data sheets and statistics in baseball. They use baseball data available on the Internet to develop an understanding of the different ways in which data can be analyzed.
Curated OER
What's Up With My Class
Learners collect data about their class and they use Excel spreadsheet to display their tables and graphs about the class. They answer survey questions and collect their data. Students create a graph of their choice to display the...
Curated OER
What Can Data Tell Us?
Students analyze data they have collected themselves and by their classmates. In groups, they create data distributions to identify the highest, lowest and middle values. As a class, they discuss the concept of sample size and how it can...
Alabama Learning Exchange
I Know What You Did Last Summer: A Data Graphing Project
Young scholars participate in graphing data. In this graphing data lesson, students make a stem and leaf plot of their summer activities. Young scholars create numerous graphs on poster boards. Students discuss the differences between...
Curated OER
Prairie Dogs: Finding the Balance
Students study about prairie dogs and determine the mean, median, and mode of a prairie dog tow's population.
Curated OER
Fly Away With Averages
Students discover the process of finding the mean, median, and mode. Through guided practice and problem solving activities, they use a computer program to input data and create a graph. Graph data is used to calculate the mean,...
Curated OER
Opening the Case
Students participate in a class survey and then design an experiment and use graphs and statistics to assist them in solving a problem. They organize the results of the survey in a stem-and-leaf plot and find the range, median, mean, and...
Curated OER
Skittles® in the Middle
Fourth graders work in small groups, using bags of Skittles?? to determine the mean of one color of Skittles?? found in each bag, in each group, and in the entire class. This is a good lesson to help motivate students to explore mode,...
Curated OER
Number in Statistics
Second graders add two and three digit numbers. They are taught how to calculate the mean and the midpoint. Students are shown how to calculate symmetrical set of numbers. They are shown a model adding the same to each increases the...
Curated OER
Timed Multiplication Test Graphs
Students use the tools of data analysis for managing information. They solve problems by generating, collecting, organizing, displaying histograms on bar graphs, circle graphs, line graphs, pictographs and charts. Students determine...
Curated OER
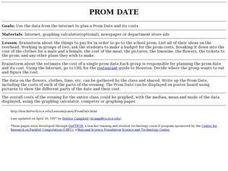
Prom Date
Students use the internet to research the cost of going to the school prom. As a class, they brainstorm about the things needed in order to go to the dance and use advertisements to make a budget. After all of the data is collected,...
Curated OER
Statistically Lyrical
High schoolers examine and discuss the writing of ratios as fractions and where they can be found in the real world. They complete worksheets and a questionnaire, and calculate the mean, median, and mode scores for the class.
Curated OER
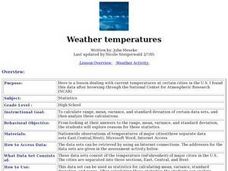
Weather temperatures
Students investigate the given statistics about temperatures in cities around the nation in order to look for a pattern. They measure the mean, median, and mode for the data set of temperatures.
Curated OER
"M&Ms"® Candies Worksheet 1
In this math worksheet, students find the likelihood of different outcomes with the use of M and M's candy for the seven questions and fill in the graphic organizer.
Other popular searches
- Math; Mean, Median, Mode
- Math Mean Median Mode
- Math/data Mean Mode Median
- Math Ata Mean Mode Median
- Math/ Mean, Mode, Median
- Math at Mean Mode Median
- Math/ Mean Mode Median


