Curated OER
Exploring Data Sets and Statistics in Baseball
Young scholars explore the concept data sets. In this data sets lesson, students find the 5 number summaries for salaries of teachers and compare them with 5 number summaries of professional baseball players. Young scholars use box and...
Curated OER
How Oceans Affect Climate
Learners draw conclusions about how the ocean affects temperature. In this weather lesson, students use the Internet to gather data to help them come to a conclusion about how the climate in a certain region is directly affected by the...
Curated OER
Great Graphing
Students collect data, use a computer spreadsheet program to create various graphs, and compare the graphs. They state the findings of each graph in writing and decide which graph type best represents the data.
Curated OER
Dealing with Data
Seventh graders collect and analyze data. In the seventh grade data analysis lesson, 7th graders explore and/or create frequency tables, multiple bar graphs, circle graphs, pictographs, histograms, line plots, stem and leaf plots, and...
Curated OER
Deal or No Deal
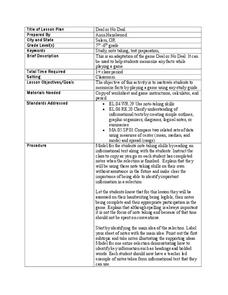
Young scholars play a game in order to memorize any set of facts. In this memorization lesson, students play an adaptation of the game Deal or No Deal to help them review and memorize factual information. Young scholars also work on math...
Curated OER
Infusing Equity Gender into the Classroom
Students investigate if gender makes a difference in the classroom. In this statistics lesson, students collect data on whether equity by gender in the classroom makes students more successful.
Curated OER
Make and use a Stem-and-Leaf Plot
In this stem-and-leaf plot worksheet, students use a given plot to solve 4 problems, then make a plot for given data and solve related problems. Houghton Mifflin text referenced.
Curated OER
High School Mathematics Problems from Alaska: Fire Fighting Crew
High schoolers apply mean, median and mode calculations of firefighter test scores to decide on hiring.
Curated OER
Fire Fighting Crew
Students use the concepts in statistics to make decisions. They calculate the mean, median and mode. They compare one firefighter against another and analyze the data. They share their information with the class.
Curated OER
Algebra: Do You See What I See?
Students discover how to find the mean, median, and mode from sets of data. By using statistical techniques such as whisker plots and bar graphs, they display the data gleaned from problems. Individually, students complete projects...
Curated OER
Challenge: Agenian Ages-Statistics
In this statistics/data learning exercise, students use given statistics of people from a fictional planet to answer 6 related questions.
Curated OER
Probability: The Study of Chance
Students practice the basic principles of probability by conducting an experiment, determining if a game is fair, collecting data, interpreting data, displaying data, conducting analysis, and stating and applying the rule for probability.
Curated OER
Statistics with State Names
Students analyze the number of times each letter in the alphabet is used in the names of the states. In this statistics lesson, students create a stem and leaf plot, box and whisker plot and a histogram to analyze their data.
Curated OER
Recognize, create and Record Simple Repeating Patterns
Students analyze, create, and record repeating patterns. In this geometry lesson, students create shapes using patterns and keep track of the different shapes. They incorporate transformation and reflections into their patterns.
Curated OER
The Guise of a Graph Gumshoe
Eighth graders practice constructing bar, circle, and box-and-whisker graphs. They practice reading and interpreting data displays and explore how different displays of data can lead to different interpretations.
Curated OER
Statistics: Final Exam Review
In this statistics and probability worksheet, students are provided with a review of the final exam in statistics. The three page worksheet contains a combination of six multiple choice and free response questions. Answers are not...
Curated OER
Exquisite Excursions
Students locate 6 cities, one on each of the 6 major continents. They find distance for each leg of their journey, convert to percents, use a time zone map, and convert to foreign currencies.
Curated OER
Probability Popsicle Pop-ups
Fourth graders decorate and use popsicle sticks as manipulatives to assist with their learning of probability. They utilize a worksheet imbedded in this plan to organize the results of their experiment. They make a stem and leaf plot...
Curated OER
Designing Detectives
Third graders explore the idea of formulating a hypothesis and designing an experiment to test the hypothesis.
Curated OER
Looking for More Clues
Fifth graders explore how to collect data and display it on a bar and circle graph.
Curated OER
Cars on the Curve
Second graders, using two dice, participate in a car race game called Cars on the Curve. They predict which car wins the game and records it in their Data Diary.
Curated OER
Graphing
Learners collect data to create different types of graphs-line, pie, and bar graphs. They use StarOffice 6.0 to create graphs.
Curated OER
Eat Your Veggies
Students investigate displaying data. In this displaying data lesson, students use tallies to count data about food preferences. Students use various types of graphs such as bar graphs, picture graphs, box-and-whisker plots, etc to...
Curated OER
Breakfast Cereal - How Nutritious Is Yours?
Students analyze the nutritional value of breakfast cereal in order to make an informed choice. They create a stem and leaf plot which analyzes the nutritional value of the cereal they eat on a regular basis. Students write a letter to...
Other popular searches
- Math; Mean, Median, Mode
- Math Mean Median Mode
- Math/data Mean Mode Median
- Math Ata Mean Mode Median
- Math/ Mean, Mode, Median
- Math at Mean Mode Median
- Math/ Mean Mode Median


