Curated OER
Means, Medians, and Modes
In this math worksheet, learners find the mean, median, and mode for each set of numbers. Then they apply the methods to the word problems.
Curated OER
Math "Hoop-la"
Students study the meaning of and the differences between mean, median, and mode. They apply their knowledge of mean, median, and mode to a real-life scenario using a basketball and a hoop.
Curated OER
Mean, Median, and Mode
Fifth graders compute the mean, median, and mode of sets of numbers.
Curated OER
Candy Colors: Figuring the Mean, Median, and Mode
Students count candy by color and then calculate mean, median, and mode. They count candy and use the data to calculate mean, median, and mode (by color) and apply their learning to another collection of data.
Curated OER
Mean, Median, and Mode 1
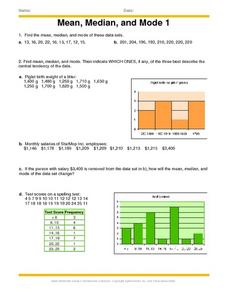
For this mean, median and mode worksheet, students use the measures of central tendency to describe given statistical data. Students identify the range of data, and match data to its representative bar graph. Two multi-step problems...
Curated OER
More Jelly Bean Math
Students use their color categorized jelly beans to find the range, mean, median and mode. They use their recorded data documenting how many jelly beans there are for each color in order to calculate the range, mean, median and mode of...
Curated OER
Math: How Many Red M&Ms?
Sixth graders calculate the mean, median, and mode of candy M&Ms and find the percentage of each color. Once they complete the assignment, they compare their results with those of the candy company's percentages. As an extension,...
Curated OER
Mean, Median, Mode, and Range: Practice
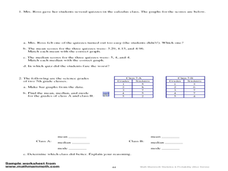
In this line plots worksheet, students make a line plot for each set of data and identify any clusters or gaps. Students then find the mean, median, mode, and range for the first four problems. Students then find n using the given mean,...
Curated OER
Quantitative Data
In this quantitative data worksheet, pupils compute measures of central tendency, draw vertical line diagrams, and compare collected data. This 23-page worksheet contains approximately 100 multi-step problems. Explanations and examples...
Mathed Up!
Frequency Tables
The section of a larger General Certificate of Secondary Education math review requires pupils to summarize numerical data presented in a frequency table. Scholars determine the number of data points, the range, the mean, and the...
Curated OER
Mean, Median, and Mode
Young scholars calculate measures of central tendency. in this mean, median, and mode lesson, students calculate the measures of central tendency. They organize data, examine and explain the statistics.
Curated OER
Using mean, median, and mode
In this mean, median, and mode activity, students read how to use each method and then complete problems using each one. Students complete 8 problems.
Curated OER
Finding Mean, Mode and Median in the Computer Lab
Students create spreadsheets which will display and figure mean, median, and mode of a set of numbers.
Curated OER
Tackling Mean - Median and Mode
Second graders wear a favorite sports jersey to school. They calculate the mean, median and mode of the numbers represented on the jerseys. They present and explain their calculations to the class.
Curated OER
Mean, Median And Mode 1
In this mean, median and mode worksheet, students problem solve and calculate the answers to ten word problems associated with the mean, median and mode of collected data.
Curated OER
Mode, Median, Mean
In this mean, median, and mode worksheet, students find the mean, median, and mode for each set of numbers given. Students complete 5 problems total.
Curated OER
Mean, Median, and Mode
In this mean, median, and mode worksheet, students find the mean, median, and mode for 4 sets of numbers and answer short answer questions about them. Students answer 5 short answer questions.
Curated OER
Mean Averages
Fourth graders examine a number of data sets while practicing finding the mean, median, and mode of the numbers.
Curated OER
Statistics
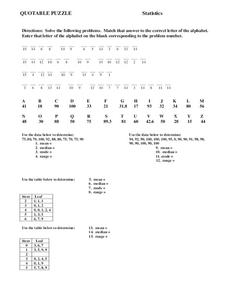
In this statistics worksheet, 8th graders solve and complete 15 different problems. First, they solve each problem by using the data given to determine the mean, median, mode, and range for each set. Then, students match that answer to...
Curated OER
Geometry Review
In this math review learning exercise, students calculate the mean, median, mode, range, line segments, angles, and standard deviation for number and word problems. Students complete 11 problems.
Curated OER
Data Analysis Self-Test
In this data analysis worksheet, students complete 1 problem that has 7 parts involving mean, median, mode, range, and quartiles. Students then perform 5 operations with matrices.
Curated OER
Stem-and-Leaf Plots
Seventh graders study steam-and-leaf plots. Given specific data, they create a stem-and-leaf plot . Students identify the mean, mode, range and median. Afterward, they review vocabulary words.
Curated OER
One, Two, Three...and They're Off
Students make origami frogs to race. After the race they measure the distance raced, collect the data, enter it into a chart. They then find the mean, median, and mode of the data. Next, students enter this data into Excel at which time...
Curated OER
WebQuest: Thrills and Spills- Pick Your Park!
Students participate in a WebQuest in which they must determine which amusement park is the "median priced" park. Students visit park websites to accumulate prices for parking, activities, restaurants, and gift shops.
Other popular searches
- Math; Mean, Median, Mode
- Math Mean Median Mode
- Math/data Mean Mode Median
- Math Ata Mean Mode Median
- Math/ Mean, Mode, Median
- Math at Mean Mode Median
- Math/ Mean Mode Median


