Curated OER
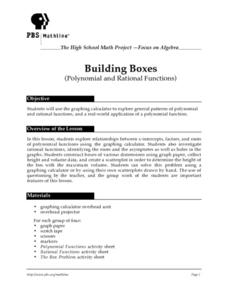
Building Boxes- Polynimial And Rational Functions
Pupils investigate the concepts of polynomial and rational functions. They identify the general patterns used to solve problems. The use of real world contexts in the problems helps to promote engagement and understanding of how the math...
Curated OER
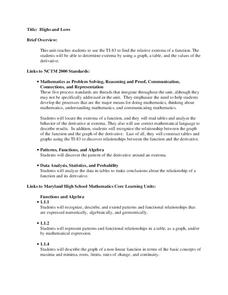
Highs and Lows
Solve problems using integration and derivatives. By using calculus, learners will analyze graphs to find the extrema and change in behavior. They then will identify the end behavior using the derivatives. Activities and handouts are...
Curated OER
Shaping Up!
Kindergartners are introduced to basic shapes. Learners spend 45 minutes a day in geometry centers carrying out the activities outlined in this ambitious plan. There are games, hands-on activities, interactive websites, art projects,...
Curated OER
Products, Multiples, Factors
In this products, multiples, and factors worksheet, students complete various activities where they solve problems for products, multiples, and factors of numbers. Students complete 14 problems.
Curated OER
Mean and Standard Deviation
Get two activities with one lesson. The first lesson, is appropriate for grades 6-12 and takes about 20 minutes. It introduces the concept of measures of central tendency, primarily the mean, and discusses its uses as well as its...
Curated OER
Racing Along the Number Line
Manipulatives and visual models really help youngsters understand mathematical concepts. One activity provided here gives every learner their own white board and accompanying number. Then learners have to put themselves in order, holding...
Curated OER
How Does Your Population Grown?
Do you know how the population has grown of your community? Can you predict the population over the next half century? Can we find an algebraic model that matches our data? These along with many more questions can be researched by...
Curated OER
Introduction to Limits
High schoolers practice using graphing calculators and spreadsheets as they explore numeric limits using sequences and functions. They complete a sequencing worksheet, and determine which sequence corresponds to story a story called...
Curated OER
Line Symmetry and Rotational Symmetry
Fifth graders investigate the symmetry of pattern block shapes. Students, working in groups determine whether each shape has line symmetry, rotational symmetry or both kinds of symmetry. Students determine how many lines of symmetry the...
Curated OER
Analyzing Discrete and Continuous Data in a Spreadsheet
You are what you eat! Your statisticians keep a log of what they eat from anywhere between a day to more than a week, keeping track of a variety of nutritional information using a spreadsheet. After analyzing their own data, individuals...
Curated OER
Altitude Tracking
Learners estimate the altitude of a rocket during several flights. They create their own altitude tracking devise. They examine and discuss their results at the end of the activity.
Curated OER
Investigation Area of Geometric Shapes
Fourth graders use triangle paper to design patterns using geometric figures and find the areas of those figures by counting units. Students are assessed by determining which figure has the greatest area and explaining their reasoning.
Curated OER
The Hudson's Ups and Downs
Even rivers have tides. Older elementary schoolers will discuss the Hudson River and how weather, water craft, and the ocean cause tidal fluctuation. They will examine a series of line graphs that depict tidal fluctuation, then analyze...
Curated OER
Application and Modeling of Standard Deviation
The first activity in this resource has learners computing the mean and standard deviation of two different data sets and drawing conclusions based on their results. The second activity has them using a dice-rolling simulation to...
Curated OER
Box Plots
Young statisticians are introduced to box plots and quartiles. They use an activity and discussion with supplemental exercises to help them explore how data can be graphically represented.
Curated OER
Our Geometic World
Pupils walk around the neighborhood and identify various polygons and lines in buildings, nature and other objects. They design a building using various geometric patterns, shapes and lines. Students complete a descriptive writing of...
Curated OER
Data Lesson Vital Information
Students prepare and collect data and use excel and create a graph. They collect data about the number of pattern blocks that are put on tables. Students then record that data in Excel.
Curated OER
Cover and Boarders
Students find the area and perimeter of rectangular figures. They use this information to find patterns and discover relationships between area and perimeter. Students apply and explain formulas relating to perimeter, area, and volume.
Curated OER
Play It
There are a number of activities here that look at representing data in different ways. One activity, has young data analysts conduct a class survey regarding a new radio station, summarize a data set, and use central tendencies to...
Curated OER
Tangrams
Students construct tangram pieces. Then they make observations and explore patterns with the pieces.
Curated OER
Lining Up the Cars
Students review how to count the total amount of arrangements using multiplication. Using a computer, they determine the amount of cars needed for a parade in their local community to move the town's officials. They identify any patterns...
Curated OER
Graphing Ordered Pairs
Here is graphing worksheet which has pupils graph ordered pairs and label the axis. They graph five ordered pairs and then interpret the data in the graph.
Curated OER
Small and Large Squares
Young mathematicians classify squares according to attributes. They sort squares according to specific attributes. Students explore squares in repeating patterns and order squares according to size. Engaging extension activities are...
Curated OER
Tessellations: Geometry and Symmetry
Young scholars explore the concept of tessellations. In this tessellations lesson, students use an applet to construct tessellations. Young scholars use regular polygons to construct tessellations. Students find patterns and symmetry in...


