EngageNY
Comparing Distributions
Data distributions can be compared in terms of center, variability, and shape. Two exploratory challenges present data in two different displays to compare. The displays of histograms and box plots require different comparisons based...
National Wildlife Federation
How Many Bison?
Math and science to the rescue! Some basic math concepts help scientists predict wildlife populations. Using tokens, groups simulate tagging a wildlife population. They then use proportions to estimate the population of the wildlife.
Curated OER
Rising Gas Prices – Compounding and Inflation
Financial literacy skills and exponential models are connected by the compound interest formula in this task centered on inflation calculations. Collaborative learners get experience collecting data from the given websites and exploring...
College of Marin
General Addition and Multiplication Rules of Conditional Probabilities
Making connections between multiple methods of solving problems is an important part of understanding conditional probability. The lesson shows solutions to problems using Venn diagrams, tree diagrams, formulas, and two-way tables....
Curated OER
Percent
In this percentage activity, 5th graders figure a given percentage for a particular number. Students solve for 12 problems giving the number amount for each percentage stated.
Curated OER
Percent Equations
In this percent equations activity, 6th graders solve and complete 9 different types of problems. First, they find the value of each percentage provided. Then, students determine the percentage of a given number.
Curated OER
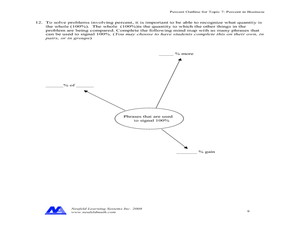
Percent in Business
In this percentages worksheet, young scholars solve word problems that include percentages in business. Students complete 14 word problems.
Curated OER
Mathematical Magazines
Students look through magazines and calculate the percentages of the types of ads in the magazines. In this percentages lesson plan, students create a graph to show their results.
Curated OER
Skittle Around with Fraction and Percentages
Fifth graders investigate the interchangeable relationship betweeen fractions and percents. They discuss the concepts using teacher provided questions. Then sutdents work in cooperative groups to maximize scaffolding.
Curated OER
Fair-division
In this division worksheet, students complete word problems with division about pizza slices, jelly servings, percentages of cards, and more. Students complete 14 problems.
Curated OER
Using Negative Numbers
Sixth graders practice using negative numbers by completing number equations. In this math problem solving lesson, 6th graders discuss the different ways negative numbers can be used in a math problem and practice completing equations...
Curated OER
Percent
In this percent worksheet, students convert percentages to fractions. Students complete 10 problems where they convert percentages to fractions and write the answers.
Curated OER
Problem-Solving Application: Make a Circle Graph
In this circle graphs activity, students analyze a data table about the activities in a day. Students then use this data to make a circle graph. Students answer 6 questions about the graph.
Curated OER
Percent
In this percent worksheet, students calculate the percent of each number. Students calculate percentages of 10 numbers and write the answers with decimals.
Curated OER
Percent
In this percent worksheet, students express fractions as percentages. Students complete 10 problems where they calculate fractions as percentages.
Curated OER
Percent
In this percent worksheet, students express fractions containing one and two digit numbers as percentages. Students complete 10 problems where they calculate fractions as percentages.
Curated OER
Find the Correct Order
By selecting a number in each of three columns to create a series of numbers arranged from least to greatest value, students will apply correct order rules. Slides include practice of ordering 3 and 4 digit numbers, fractions, mixed...
Curated OER
Pizza Equality
In this fractions worksheet, students draw pepperonies on the number of slices that each pizza tells them too. Students then write the percentage of pieces that have pepperonies on them.
Curated OER
Grid and Percent It
Students explore percent. In this percent lesson, students investigate how to represent percentages on a hundreds grid. Working independently, students solve mathematical problems involving percentages.
Curated OER
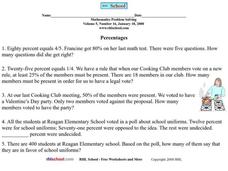
Percentages
In this percentages worksheet, students problem solve five mathematical word problems associated with percents and percentages.
Curated OER
Percentages
In this online math worksheet, students practice converting from decimals to percents. When complete, students submit their answers and get instant feedback regarding their accuracy.
Curated OER
Math Practice: Circles
In this circle learning exercise, students solve 8 problems: finding percentage increase, finding differences in area and perimeter, finding circumference and area.
Curated OER
Monitoring Math with a Statistical Spreadsheet
Students use a spreadsheet to compute landmark statistics of a math
quiz. This lesson plan can be ongoing throughout the school year and it integrates mathematics curriculum and technology in a simple format for student use.
Mathematics Assessment Project
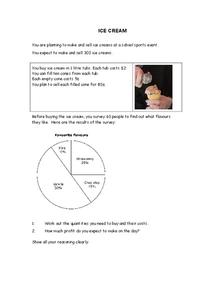
Ice Cream
I scream, you scream, we all determine the amount of ice cream! Pupils calculate the amount of ice cream flavors needed based on survey results in a short summative assessment. They determine the number of tubs and cost of ice cream to...
Other popular searches
- Percentages and Math
- Calculator Math Percentages
- Learning Math Percentages
- Math Percentages Diagram
- Teaching Percentages in Math
- Math Percentages Ecology
- Math Percentages Decimals
- Teaching Math Percentages
- Football Math Percentages
- Everyday Math Percentages
- Converting Math Percentages
- Math Percentages Jerry P


