Curated OER
When the Snow is as High as an Elephant
High schoolers study the concept of mean values using a data plot. Learners enter the given data in the activity to create their data table. They use the data table to calculate the mean of the snowfall percentage provided in the...
Math Mammoth
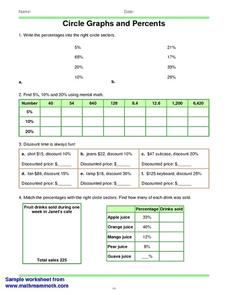
Circles Graphs and Percents
In this percent instructional activity, students read and interpret circle graphs. They determine discounts, and match percentages with circle sectors. This one-page instructional activity contains approximately 30 problems.
Curated OER
Spitzer Explores a Dying Star
For this dying star worksheet, students read about the Spitzer Space Telescope that detected the dying star-Messier-57. Students solve 6 problems including determining the total power produced by the dying star, they find the total mass...
Curated OER
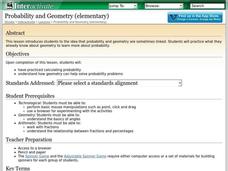
Probability and Geometry
Students examine the relationship between probability and geometry to solve problems. In this geometry and probability lesson, students investigate the effect of changing percentages on a spinner to the probability of landing on a...
Curated OER
Let's Build a Worm Bin
Students explore the process of decomposition. In this ecology and measurement lesson, students prepare a worm home to be used for vermicomposting. Students weigh a group of worms and the added food, recording this information on a data...
Curated OER
Planet Earth in Cross Section
Young scholars will examine the layers of the Earth. For this geology lesson, students create a scale model of the Earth's interior using cash register tape. They will determine the percentage of error in the scale compared to the actual...
Curated OER
Percent of Increase and Decrease
In this change in percent worksheet, students find the percentage of increase and decrease of a number. There are four problems to solve.
Curated OER
Money: Kids and Cash
Young scholars discuss what a bank is and what it is used for. For this mathematics lesson, students solve problems related to interest and percentages.
Curated OER
Surface Area and Measuring
Tenth graders explore volume and surface area through percentages. In this geometry lesson, 10th graders analyze the surface area of two and three dimensional shapes, then use percents and ratio to compare the two.
Curated OER
Fashion Sense and Dollar Wise
Students work in groups to show understanding of the relationship between fractions, decimals, percentages, and the application of ratios and proportions. In this decimals, fractions, and percents lesson, students use real life consumer...
Curated OER
Fashion Sense and Dollar Wise
Young scholars find the cost of an outfit. In this percentages lesson, students look at ads, pick out an outfit, and find the sale price. They create a commercial and complete 4 included worksheets.
Curated OER
Deal or No Deal?
Using a game format, learners engage in an activity called Deal or No Deal. Taking real life scenarios involving items for sale, such as cereal boxes three for $5.00, they determine whether an example is a deal or not. This lesson...
Curated OER
Careers Lesson: Budget Analysis
Ninth graders examine money management. They study percentages, inequalities, fixed and variable expense calculations in order to develop an understanding of how these concepts apply to budgeting a lifestyle for a specific career.
Curated OER
Finding Fractions of Numbers and Quantities
A presentation teaches young learners to find fractional values and quantities, and provides tips on how to solve math word problems. Learners engage with dozens of challenging problems, and get tips along the way. A terrific PowerPoint...
Curated OER
Going Up Or Coming Down
Students find the percent of increase or percent of decrease. Through a teacher demonstration, they examine the methods of calculating percentages. Students solve real life problems.
Curated OER
Geometry Review
In this math review worksheet, students calculate the mean, median, mode, range, line segments, angles, and standard deviation for number and word problems. Students complete 11 problems.
Curated OER
Family Letter and Activity: Cars, Trucks and Percents
In this math learning exercise, students will take home a letter to their parents explaining that they are studying Chapter 10: Ratio, Proportion and Percent. Then students will complete a homework activity in which they ask family and...
EngageNY
Percent of a Quantity
Visualize methods of finding percents. Classmates find a percent of a quantity using two methods including a visual model in the 26th lesson in a series of 29. By the end of the lesson, scholars find percents given a part and the whole...
Curated OER
Board Game
In this percents learning exercise, students roll the dice and say a problem that fits the percentage in the space. Students complete 20 spaces total.
Curated OER
Comparing Percents of Numbers (A)
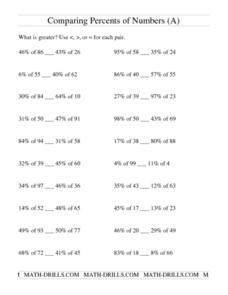
In this inequalities practice worksheet, students use their math skills to compare 20 pairs of 3 percentage problems. Students solve the problems and fill in the blanks with greater than, less than, or equal to symbols.
Virginia Department of Education
Box-and-Whisker Plots
The teacher demonstrates how to use a graphing calculator to create box-and-whisker plots and identify critical points. Small groups then create their own plots and analyze them and finish by comparing different sets of data using box...
Virginia Department of Education
May I Have Fries with That?
Not all pie graphs are about pies. The class conducts a survey on favorite fast food categories in a lesson on data representation. Pupils use the results to create a circle graph.
Curated OER
Integrating Functions
In this math worksheet, students find the answers to the functions that includes integration and trigonometry. They use the examples for help with the special functions.
Curated OER
Problem Solving: Compare Data Sets
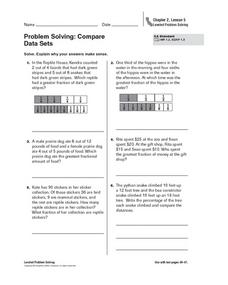
There are a variety of techniques students can use to compare fractions. In this worksheet on fractions, 5th graders are shown a way to create a visual comparison and asked to solve word problems. Students are encouraged to draw a...
Other popular searches
- Percentages and Math
- Calculator Math Percentages
- Learning Math Percentages
- Math Percentages Diagram
- Teaching Percentages in Math
- Math Percentages Ecology
- Math Percentages Decimals
- Teaching Math Percentages
- Football Math Percentages
- Everyday Math Percentages
- Converting Math Percentages
- Math Percentages Jerry P


