Curated OER
Seeing a Dwarf Planet Clearly: Pluto
In this dwarf planet worksheet, students use images from the Hubble Space Telescope and they determine the scale of the image, they identify the largest features in the images, they calculate the volume of Pluto and they create a model...
Curated OER
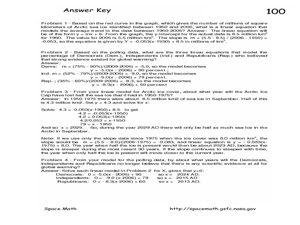
The Global Warming Debate and the Arctic Ice Cap
In this global warming and the Arctic ice cap activity, students use two graphs showing data about the amount of Arctic sea ice between 1950 and 2006 and the percent of people surveyed that believe the Earth has gotten warmer over the...
Curated OER
Spinning Probability
Sixth graders study the concept of probability. In this probability lesson, 6th graders create spinners that match specific sets of clues. Students use their spinners and worksheets to explore and predict probability.
Curated OER
The Importance of Trees in the Rural Area: Planting a Snowfence
Students discuss the importance of trees and work together to plant a living snowfence. In this tree importance lesson, students discuss why trees are important in rural areas. They use mathematics and team work to plant a living snowfence.
Curated OER
Fractions, Decimals, and Percents
In this middle school mathematics learning exercise, students convert between fractions, decimals, and percents in problem solving situations. The one page learning exercise contains ten problems. Answers are included.
Curated OER
SAT Problem Solving Practice Test
In this problem solving practice test, students select the best answer from 4 choices to ten questions. Questions are word problems and cover a variety of topics.
Curated OER
The World is a Village
Learners observe Americans through the eyes of the world. In this human population lesson, students utilize the Internet to view the World Pop Clock and follow the world's population by the minute. Learners predict what the world's...
Curated OER
Union and Intersection of Sets
In this Algebra I/Algebra II worksheet, students determine the intersection and union of sets and solve problems with Venn diagrams. The three page worksheet contains a combination of seventeen multiple choice and free response...
Curated OER
Geometric Figures
Students compare, classify and calculate the area of geometric figures such as rectangles, squares, circles and triangles.
Curated OER
Weight Training
Students conduct a class-wide survey collecting, compiling, and analyzing data about fitness, weight loss, and body image issues. They analyze the relationship between exercise and diet in weight control.
Curated OER
Epidemic Proportions
Students research epidemics that have devastated world population at various points in history. They share and calculate statistics obtained in their research and develop graphs comparing and contrasting how different epidemics affect...
Curated OER
The Discount Is Right
Learners estimate and calculate the sale price of five items using the original price and a designated rate of discount. They use percent to calculate the rate of discount and the original.
Curated OER
Graphing
Students collect data to create different types of graphs-line, pie, and bar graphs. They use StarOffice 6.0 to create graphs.
Curated OER
Inflation: Taking Prices Higher
Students examine the definition of inflation and its impact through history. They read and discuss online text, discuss examples of inflation, calculate the prices of various items for different years using an inflation rate of 3%, and...
Curated OER
A Tough Nut to Crack
Children, based on a set of criteria, evaluate the quality of pecans. They research recorded history of pecan trees as well as how their seeds moved across western Missouri into southeastern Kansas, Oklahoma, Texas and Mexico. In...
Curated OER
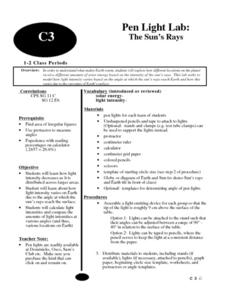
Pen Light Lab
Students study what makes Earth warm and explore how different locations on the planetreceive different amounts of solar energy based on the intensity of the sun's rays. They calculate light intensities and compare the
amounts of light...
Curated OER
Circles
For this circles worksheet, 10th graders solve 10 different problems that include determining the chords, secants, and tangents of circles shown. First, they determine 4 different line segments given a circle with secants and chords with...
Curated OER
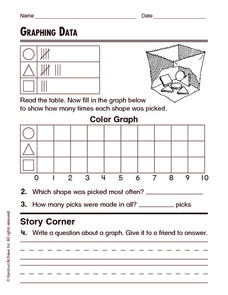
Graphing Data
In this graphing data worksheet, students solve and complete 8 different word problems related to graphing data given. First, they determine the percent of people who do not believe in any of the phenomena described and explain. Then,...
Curated OER
Find the Mystery Lines...If You Can!
In this atomic spectral lines worksheet, students observe a diagram of the spectral lines, their different wavelengths and their intensity. They solve 4 problems which include interpreting the scale, matching up tabulated lines with the...
Curated OER
Cosmic Rays and Solar Cells
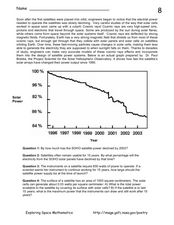
In this cosmic rays and solar cells worksheet, students read about how cosmic rays damage the electrical output of solar cells over time on satellites. Students use a graph of the solar power output compared to the year for the SOHO...
Curated OER
Magnetic Storms
In this magnetic storms and Earth's magnetic field activity, students use a bar graph showing the Kp Index for planetary variability. Students use the bar graph to answer 3 questions about the solar storms and their Kp values.
Curated OER
Do Fast CMEs Produce Intense SPEs?
In this coronal mass ejections and Solar Proton Events worksheet, students create a Venn Diagram to represent given data. They answer 5 questions about the data related to the number of coronal mass ejections and Solar Proton Events...
Curated OER
Economics: Supply, Demand & Personal Finance
In this Economics/Personal financial literacy worksheet, students use USA Today to find article, photos, charts, or graphics related to events that are affecting the prices of different products and services. Students answer questions...
Curated OER
What's in Soil?
Young scholars examine soil samples and make observations. For this soil lesson, students participate in experiments to determine the components (mineral matter, organic matter, water air) in the soil. Young scholars analyze a pie graph...
Other popular searches
- Percentages and Math
- Calculator Math Percentages
- Learning Math Percentages
- Math Percentages Diagram
- Teaching Percentages in Math
- Math Percentages Ecology
- Math Percentages Decimals
- Teaching Math Percentages
- Football Math Percentages
- Everyday Math Percentages
- Converting Math Percentages
- Math Percentages Jerry P


