CCSS Math Activities
Golf Balls
Land on the green with a fun resource. A short performance task asks pupils to consider the volume of containers that hold golf balls. They determine the percentage of empty space of the container for different numbers of golf balls.
Curated OER
M&Ms Count and Crunch
Learners practice skills involving statistics and probability by making predictions on number of each color candy in one pound bag of M&Ms. They record both guesses and actual quantities, calculate percentages, and create bar graphs...
Curated OER
Bar Graphs and Survey Questions- Internet Access
In this graphing and data collection activity, young scholars examine a bar chart that show data collected from 1998 - 2006 that shows the percentage of households that have Internet access. They answer questions based on the chart and...
Math Worksheets Land
Patterns of Association (Using Data Tables) - Guided Lesson
The worksheet belongs to a four-part resource that applies percentages to data tables. The page has three practice problems that continues with the development of this topic.
Curated OER
Integrating Gandhian Principles of Communal Unity in Mathematics
Fourth through sixth graders incorporate Gandhian principles into Math curriculum. They explore Gandhi's teachings on communal unity and economic equality. This has quite a bit of information about Gandhi and his observations and...
Balanced Assessment
Who's Left?
If you're not right-handed, are you wrong-handed? Young statisticians calculate the percentage of left-handed people using a given data set in the assessment task. They plot data on a scatter plot and consider how the line of best fit...
Curated OER
Chances Are......You're Right
Young mathematicians study probability. In this math lesson plan, learners calculate odds, and convert those into percentages of probability. Fractions are also used, making this lesson plan quite rich in some of the more difficult...
Math Worksheets Land
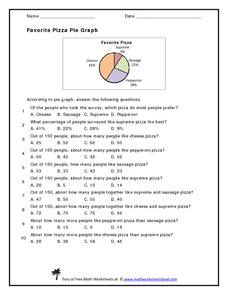
Favorite Pizza Pie Graph
You've heard of a pie graph, but what about a pizza pie graph? Challenge young mathematicians to answer ten questions based on a random survey of people's favorite pizzas. A pie graph displays the percentages of each type of pizza. Some...
Curated OER
Solid Waste
Students determine the percentage increase in output of solid waste in the U.S. They determine the length of time it takes for throw away items to decompose.
Illustrative Mathematics
Security Camera
A different-than-normal problem that allows learners to practice their reasoning to find an answer. The problem bases itself off a graph drawing of a store that needs to install security cameras. The challenge is to find which placement...
Curated OER
Quinoa Pasta 3
A mixture of quinoa and corn is for dinner in this collaborative task that sets up nicely as a system of linear equations. Your supper guests discuss numerical precision and percentages as they formulate a plan of how to solve the problem.
Mathematics Assessment Project
25% Sale
Free clothes? In the middle school assessment task, learners first consider whether four 25 percent reductions will result in a sale price of $0. Mathematicians then determine the sale price and discount percentage of such a sale.
Illustrative Mathematics
Latitude
The greater the latitude, the less of the Earth is north. Scholars graph the relationship between the latitude and the percentage of the Earth that is north of the latitude. Using the graph and the table, class members interpret values...
Curated OER
Our Solar System - Comparing Planetary Travel Distances
NASA presents a mini-unit on distances in our solar system. It incorporates scientific concepts of gravity, mass, density, and payload while your aspiring astronauts also employ mathematics skills. They calculate speed, they determine...
National Research Center for Career and Technical Education
Business Management and Administration: Compound Interest - A Millionaire's Best Friend
Many math concepts are covered through this resource: percentages, decimals, ratios, exponential functions, graphing, rounding, order of operations, estimation, and solving equations. Colorful worksheets and a link to a Google search for...
DK Publishing
Real-life Problems, Working with Fractions
Test your fifth graders' math skills with five word problems involving fractions. After studying two examples at the top of the page, pupils multiply fractions by whole numbers to solve each word problem. The activity provides two...
EngageNY
Margin of Error When Estimating a Population Proportion (part 1)
Use the power of mathematics to find the number of red chips in a bag — it's a little like magic! The activity asks learners to collect data to determine the percentage of red chips in a bag. They calculate the margin of error and...
Curated OER
Multiplication and Areas
Upper graders solve problems involving measurement of squares and rectangles to practice multiplication skills, finding area, and calculating prices and percentages. A performance assessment is included.
Curated OER
Ratios, Rates, Percent and Nutrition
Examine food labels to determine percentage of fat and sugar to total calories with middle schoolers. Daily nutritional guidelines are discussed and learners will decide how well their foods fit into a healthy diet. In the provided...
Curated OER
Rating Systems
Your favorite sports team is ranked #1. How do the powers that be determine this rating? Learn how ratings are mathematically computed using probability concepts, from the Elo Rating System for chess to the Rating Percentage Index for...
Bowland
AstroZoo
Rescue animals in the zoo by applying math concepts. Groups of learners solve three missions involving oxygen, food, and climate control. Each group selects an animal from one of four bio-domes.
Curated OER
Law of Large Numbers - Hospital
Students explore concepts of probability and independent events. They develop a formula for deviation percentage.
Curated OER
Money Percentages Matching
Students practice identifying coins and their respective percentage.
Curated OER
Percentages and Fractions of Amounts
In this math worksheet, students change percents to fractions on five problems. Students complete a table. Students find a given percent of five numbers. They complete five story problems involving percents.
Other popular searches
- Percentages and Math
- Calculator Math Percentages
- Learning Math Percentages
- Math Percentages Diagram
- Teaching Percentages in Math
- Math Percentages Ecology
- Math Percentages Decimals
- Teaching Math Percentages
- Football Math Percentages
- Everyday Math Percentages
- Converting Math Percentages
- Math Percentages Jerry P


