Curated OER
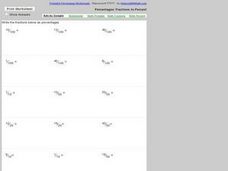
Percentages: Fractions To Percent
In this percentages worksheet, students write eighteen fractions as percentages. Students problem solve each fraction as a percentage.
Illustrative Mathematics
Do You Fit In This Car?
A short activity that focuses on the normal distribution as a model for data distribution. Using given means and standard deviations, your budding statisticians can use statistical tables, calculators, or other statistical software to...
Curated OER
Statistical Calculations Using M&Ms
In this frequency activity, students investigate, frequency, box plots, and percentage using a package of M&Ms. Copies of the actual correspondences with the Mars company are also included.
Bowland
Mystery Tours – Plan Your Tour
Everyone loves a vacation and a set of three activities has groups planning a tour of the U.K. using given distance, time, and price data. They solve a variety of problems related to the trip and produce a report on the success of the trip.
Balanced Assessment
Dart Boards
Bulls eye! Design dart boards with specific chances of winning. Individuals determine the probability of hitting a circular and a triangular dart board inscribed in squares. They create dart boards that have a 50 percent chance of...
Bowland
Explorers – Patrol Services
Far out — plan a trip to space! Aspiring mathematicians steer a space vehicle through an asteroid field, calculate currency exchanges to buy provisions, and determine placement of charges to blow up asteroids. Along the way, they learn...
Curated OER
Venn Diagrams & Word Problems
Students explore the concept of Venn Diagrams through word problems. In this Venn Diagram activity, students solve word problems about groups of people using Venn Diagrams. Students use survey results about MySpace and Facebook in a...
Curated OER
Take Another Look
Seventh graders analyze different types of graphs and answer questions related to each. In this math lesson, 7th graders organize a given diagram to make it easier to interpret. They discuss why they made such changes.
Curated OER
The Good, The Bad, The Ugly
Sixth graders examine the causes of the stock market crash of 1929. In this integrated math/history unit on the stock market, 6th graders study, research, and read stocks, visit a local bank, and create a PowerPoint to show the finished...
Curated OER
Shopping for Savings
Fourth graders calculate savings and identify the best value items from a list of products. They rotate through five studying stations, completing various math activities involving calculators and solving problems related to shopping...
Curated OER
Find the Mystery Lines...If You Can!
In this atomic spectral lines worksheet, students observe a diagram of the spectral lines, their different wavelengths and their intensity. They solve 4 problems which include interpreting the scale, matching up tabulated lines with the...
Curated OER
Do Fast CMEs Produce Intense SPEs?
In this coronal mass ejections and Solar Proton Events worksheet, students create a Venn Diagram to represent given data. They answer 5 questions about the data related to the number of coronal mass ejections and Solar Proton Events...
Curated OER
Family Letter and Activity: Cars, Trucks and Percents
In this math worksheet, students will take home a letter to their parents explaining that they are studying Chapter 10: Ratio, Proportion and Percent. Then students will complete a homework activity in which they ask family and friends...
Curated OER
Problem Solving: Compare Data Sets
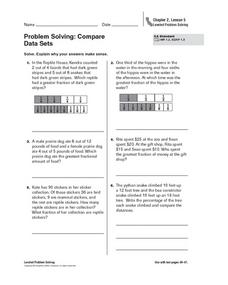
There are a variety of techniques students can use to compare fractions. In this worksheet on fractions, 5th graders are shown a way to create a visual comparison and asked to solve word problems. Students are encouraged to draw a...
Curated OER
Number: Fractions
Students explore equivalencies. In this decimals and fractions instructional activity, students examine number relationships and patterns as they compare whole numbers to decimals. Students complete a worksheet that requires them to...
Curated OER
What is Soil?
Third graders examine what makes soil by creating a Venn Diagram. In this Earth environment lesson, 3rd graders identify the different components that soil is made from. Students bring soil from their homes to examine and create a Venn...
Curated OER
The Multiplier (larger 2-digit by 1-digit numbers)
Students utilize number sense applications to multiply two digit numbers. They use "The Multiplier" and Internet source to partition and solve 2 digit by 1 digit multiplications. Students describe how to solve 2-digit by 1-digit...
Curated OER
The Part-Adder 2
Third graders use mental-math strategies to solve two-digit plus two-digit addition problems. They observe and discuss online demonstrations, solve word problems as a class, and independently solve problems and describe their solutions...
Curated OER
Tangents and Circles
In this tangents and circles worksheet, 10th graders solve 10 different problems that include various tangents and circles. First, they determine in each diagram whether the segments shown are tangents or not. Then, students determine...
Curated OER
The Colored Cube Question
Fourth graders examine how to determine the probabilities or likelihood of outcomes. They complete trials to determine probability while using different manipulatives. They determine how games can be made fair or unfair in this unit of...
Curated OER
Taxes and Sales
Collaborative discussions around this retail store problem will be taxing. Calculating discount and tax and the order of the operations are used to motivate an opportunity for learners to make a convincing argument using algebraic...
Curated OER
GSE Foundations of Algebra: Equations and Inequalities
Need lessons on writing and solving one- and two-step linear equations and inequalities, as well as systems of equations? This comprehensive 106-page module from the Georgia Department of Education contains many different lessons for a...
Curated OER
Handling Data: Comparing Distributions
Students gather information by analyzing graphs, diagrams and pie charts. In this graphs and diagrams instructional activity, students complete addition and subtraction problems. Students discuss a pie chart. Students use information to...
Curated OER
Handling Data: Representing Date - Online Version
Here is an online lesson plan on data representation. In it, learners access websites embedded in the plan which lead them through a variety of activities around data representation and statistics. The activities are quite good, and...


