Curated OER
Graphing Fun
First graders analyze objects and make a graphing picture to analyze the data. In this graphing activity, 1st graders complete an object graph assessment, a picture graph assessment, and a bar graph assessment to analyze their given...
Curated OER
Energy Resources
In this energy resources worksheet, students complete 12 questions in the format of puzzles, teasers, and twisters. Examples include a modified cryptoquip and pictogram.
Curated OER
Math Made Easy
Young scholars evaluate word problems. In this problem solving lesson plan, students are presented with word problems requiring graphing skills and young scholars work independently to solve.
Curated OER
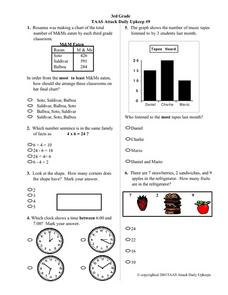
3rd Grade TAAS Attack Daily Upkeep #9
In this math literacy worksheet, 4th graders practice interpreting the pictographs in order to assemble the information to find the solutions to the 13 problems.
Curated OER
THIS WEEK'S WEATHER
First graders create a picture graph representing their town's weather for one week.
Curated OER
Graphing Data
First graders learn how to display data using a bar graph. In this bar graph lesson, 1st graders use data from a t-shirt color survey to make a bar graph. They also make an animal bar graph before interpreting the information.
Curated OER
Graphs in the News
In this graphs worksheet, learners locate 2 kinds of graphs in the newspaper and answer short answer questions about them. Students complete 3 questions.
Curated OER
Range and Mode
Fifth graders interpret data. In this mode and range lesson, 5th graders define mode and range and practice finding them given a set of data.
Alabama Learning Exchange
Inch by Inch
Third graders listen to a read-aloud of Leo Lionni's, Inch by Inch before measuring a variety of items using both standard and metric units. They record the measurement data and follow a recipe for dirt pie.
Alabama Learning Exchange
Poppin' For Popcorn!
Students graph data from different popcorn flavors. In this graphing lesson, students make graphs using an assigned web site after collecting data about the flavors of popcorn that fellow classmates prefer.
Curated OER
Where Do I Fit on the Graph?
Students collect data and create graphs about themselves, their community, and the world around them. They use a variety of methods to organize data, such as stickers, clothespins, name tags, coloring, tally marks, etc.
Curated OER
If Our Class Went to See the Prince
First graders read the story One Monday Morning and create picture graphs based on the number of teachers, boys, and girls that would visit the prince. In this data lesson plan, 1st graders interpret tables and graphs with the help of...
Curated OER
Graph Your Foot!
Students measure their own foot and place the outline on a graph. They make connections between the size of their foot and the bar graph that represents it.
Curated OER
Cars on the Curve
Second graders, using two dice, participate in a car race game called Cars on the Curve. They predict which car wins the game and records it in their Data Diary.
Curated OER
Bow Wow, Oink Oink
Students read Everybody Cooks Rice and discuss birthday celebrations around the world. In this cultural differences lesson, students discuss the Chinese symbols by birth years. Students create a graph by symbol. Students display...
Curated OER
Download and Analyze
Young scholars download information from a NASA website into a database. They transfer it to a spreadsheet by completing the information and analyze the information. They determine temperature averages, mode, and graph the results. They...
Curated OER
Step Into My Shoes
Students order their classmates from smallest to largest foot length. In this ordering their classmates from smallest to largest foot length lesson plan, students trace each of their classmates foot. Students read a story called, 'How...
Curated OER
Favorite Days
Students collect and organize data about themselves. In this data analysis lesson, students discuss their favorite calendar dates and explore ways to display the data.
Alabama Learning Exchange
The Grouchy Ladybug
Students listen to the book, "The Grouchy Ladybug" by Eric Carle and sequence the events in the story. Using a graph, they draw and color the animals that the ladybug meets next to the corresponding time from the story, and conduct...
Curated OER
Pancakes, Anyone?
First graders explore data collecting and graphing. In this data collecting and graping lesson, 1st graders watch a video about monster who sells pancakes. Students make a graph to record the most popular pancake. Students also play...
Curated OER
Probability Popsicle Pop-ups
Fourth graders decorate and use popsicle sticks as manipulatives to assist with their learning of probability. They utilize a worksheet imbedded in this plan to organize the results of their experiment. They make a stem and leaf plot...
Curated OER
Creating a Graph
Students brainstorm favorite things to do during the summer. They survey classmates to collect data, arrange it in a chart, and create graphs using ClarisWorks.
Curated OER
The Human Graph
Students produce a graph of favorite colors. For this graphing lesson, students create a human graph based on their favorite color then the teacher transfers the data to a bar graph. Students compare the lines on the graph before...
Curated OER
When is Your Birthday?
Students use data about their birthdays to create graphs. In this collecting and communicating information lesson, students make a class list of their birthdays. Students use the information to make a bar graph showing the information.


