Curated OER
Graphing
Students investigate graphing. In this bar graph lesson, students view an informational website about graphing, then construct a class birthday bar graph outside with sidewalk chalk. Students choose a survey topic, then collect data and...
Curated OER
How Long? How Wide?
Second graders distinguish between and use nonstandard and standard units of measurement, use appropriate tools and techniques to measure length and width, and record and interpret data using graphs.
Curated OER
Away We Go!
Students study types of transportation. In this transportation lesson, students survey several classes to gather data on how they get to school. Students create a transportation graph.
Curated OER
Graphing With Candy
Students gather information and interpret the results using a tally chart, a table, and a bar graph.
Curated OER
Drawing Bugs Game
Second graders explore probability by playing a drawing game with dice. After they roll a die, they draw a tree diagram to illustrate each of the possible outcomes.
Curated OER
Yummy Apples!
Students discuss apples and how they are grown. They listen as the teacher reads "Apples," by Gail Gibbons. Students discuss the story. They view several different types of apples and compare their characteristics. Students taste several...
Curated OER
Flight of Angles of Inclination
Students measure the flight of a gilder. In this fight of angles lesson, students explore the flight of a glider and measure the distance flown. They collect statistical data of the flights and determine the slope of each flight. ...
Curated OER
Frequency, Histograms, Bar Graphs
For this statistics worksheet, students plot and graph their data, then interpret the data using the correct form of graphs. There are 3 detailed questions with an answer key.
Curated OER
Decisions, Decisions, Decisions
Students examine graphs to find the most appropriate for various kinds of data. In this graphing instructional activity, student create bar, line and circle graphs. Students create graphs electronically and manually interpreting the data.
Curated OER
Venn Diagram and UK Basketball
Students analyze data and make inferences. In this algebra lesson, students collect and analyze data as they apply it to the real world.
Curated OER
Creating Graphs
This graphing PowerPoint demonstrates how to use graphs to gather information. The slides contain examples of graphs and display the data clearly. This presentation also gives clear directions on how to construct various graphs by using...
Curated OER
Statistics for Graphing
Students use the Internet to access a variety of websites that present statistics and information for use in graphing. They represent sports statistics, geographical measurements, temperatures and more.
Curated OER
Graph It!
First graders use organized data to construct real object graphs, picture graphs, and bar-type graphs.
Curated OER
The Garden
Students talk about the types of insects that you might see if you looked in the garden. They then brainstorm for ideas about how to solve the problem, sort objects into categories and display the results and count the objects in a...
Curated OER
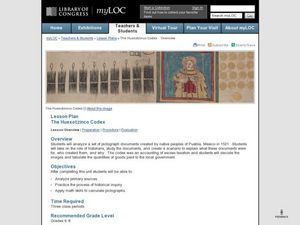
Lesson PlanThe Huexotzinco Codex
Students examine primary sources that include pictographs from Puebla, Mexico. In this Huexotzinco Codex instructional activity, students perform historical analysis as they investigate the codex as they make inferences and draw...
Curated OER
Name Fame
First graders learn the uniqueness of their names by reading the book, Chrysanthemum, and completing other integrated math counting and graphing activities.
Curated OER
Tulip Graphing
Students create a graph of tulip growth. In this data analysis lesson, students plant tulip bulbs and use graph paper to begin graphing data on the growth of the tulip.
Curated OER
Let's Graph It! Pre-Test
In this graphing worksheet, students complete a set of 10 multiple choice questions, clicking on a link to see correct answers or print the page.
Curated OER
Questionnaires and Analysis
Young scholars, review the techniques and different types of data analysis as well as how they are expressed, identify why facts and data are needed in conclusion of a questionnaire. The concepts of qualitative and quantitative data are...
Curated OER
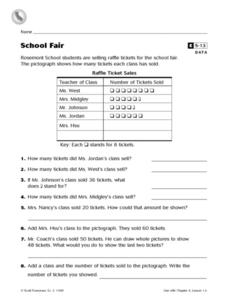
School Fair
In this data worksheet, students look over a table containing data collected from selling raffle tickets and then answer 8 short answer questions relating to the table.
Curated OER
Use Information in Line, Bar, Circle, and Picture Graphs to Make Comparisons and Predictions
Eighth graders explore the concept of graphs. In this graphs lesson, 8th graders compare and contrast picture graphs, bar graphs, line graphs, and circle graphs. Students examine each type of graph and answer questions and make...
Curated OER
Calendar Communication
Students identify days, dates, and month on a calendar. For this calendar lesson, students use a blank calendar page and fill in the days of the month. Students recall what they learned on specific days and record that information as well.
Curated OER
Leap Frog Experiment
Second graders ask questions and design an experiment to explore different spinners in "The Leap Frog" board game. They conduct their experiment, collect information and interpret the results using a graph.


