Curated OER
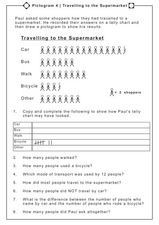
Pictogram 4: Traveling to the Supermarket
In this creating and comprehending a tally chart worksheet, students use a pictograph to tally the number of ways people traveled to the supermarket, tally the results, and answer comprehensive questions. Students answer 8 questions.
Curated OER
Gummy Bear Picture Graph
First graders investigate picture graphs. In this graphing lesson, 1st graders create a picture graph with the x-axis being number and the y-axis being color. Students sort their gummy bears by color and use pictures of colored bears...
Curated OER
A Blast of Math
For this metric measurement worksheet, students solve 20 fill in the blank questions related to metric measurement, converting metric units, area of rectangles, picture graphs, patterns, geometric shapes. Students then convert 9...
Math Moves U
Collecting and Working with Data
Add to your collection of math resources with this extensive series of data analysis worksheets. Whether your teaching how to use frequency tables and tally charts to collect and organize data, or introducing young mathematicians to pie...
Curated OER
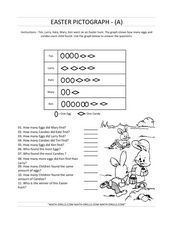
Easter Pictograph
In this pictograph worksheet, students look at the Easter pictograph and solve problems based on the graph. Students complete 10 problems.
Curated OER
Read a Pictograph
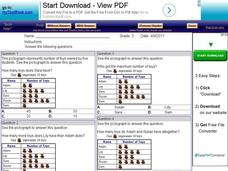
In this data display activity, students solve 4 problems in which data on a tally chart and pictograph are analyzed. Students use this information to solve the problems.
Curated OER
Making a Pictograph
In this pictograph activity, students use a picture to make a pictograph, then solve 2 related problems. Students also complete a "Test Prep" question about the graph.
Curated OER
Pictographs
In this pictographs worksheet, 7th graders solve 6 different problems related to the pictograph shown at the top of the sheet. First, they pretend that they counted birds and their numbers are represented in the pictograph. Then,...
Curated OER
Hats for Sale
What type of hat do you think sells the best? Elementary learners will use the picture graph provided to answer the comprehension questions. A chart accompanies the picture graph, so youngsters can see the data multiple ways.
Alabama Learning Exchange
Tiger Math Graphing
Learners practice various skills using the book Tiger Math: Learning to Graph from a Baby Tiger. After listening to the story, they create a pictograph using data collected from the text. They also color a picture of a tiger, collect...
Curated OER
Shooting Stars Pictograph
In this pictograph worksheet, students use a given graph to answer a set of 5 questions. A website reference for additional resources is given.
Curated OER
Survey Says...
Young learners create and implement a school-wide survey about student body favorites! Learners record and analyze the data on a bar graph, picture graph, and line graph, and then display the data. Then, wrap it all up with a celebration...
Curated OER
Kids/Blocks/Learning
Help develop graphing skills in your young learners.. They create a picture graph, represent 1:1 correspondence, represent same and different, and draw conclusions. They write an experience story about the conclusions drawn from the...
Curated OER
Math: Graphs and Their Symbols
Second graders examine different types of graphs and discover the meanings of the symbols used on them. After gathering data about themselves, their communities, and the world, they use that information to create graphs. Among the...
Curated OER
Sunshine Math- 2 Earth, IV
In this math problem solving worksheet, students complete 6 problems that include: pictographs, reasoning, basic operations, and money.
Curated OER
Sunshine Math- 5 Saturn, III
In this problem solving worksheet, students complete 8 varied problems that include: money, pictographs, fractions, symmetry and basic operations.
Curated OER
Using Pictographs With Data
In this using pictographs with data worksheet, 3rd graders read data from a pictograph to answer ten multiple choice questions. Answers can be shown on the screen.
Curated OER
Creating and Reading a Pictograph
Second graders examine how data can be transferred into pictures on a pictograph. They analyze data on a graph about chewing gum, and create a pictograph that illustrates data about their preferences for the taste of bubble gum. ...
Curated OER
Interpreting a Pictogram
In this pictogram worksheet, students interpret a pictograph on ladybirds and answer 5 short answer questions or drawings referring back to the pictogram. Students carry out their own scenario pictogram and draw a table with their results.
Curated OER
Lucky Charms Pictograph
Third graders create pictographs using a breakfast cereal. This fun, hands-on lesson allows students to use Lucky Charms cereal to create a pictograph. When the lesson is through, 3rd graders get to eat their Lucky Charms marshmallows.
Curated OER
Classmate Pictograph
Young scholars create pictographs using their classmates in this technology-based lesson. The lesson uses Inspiration, or Kidspiration, digital cameras, and a downloadable pictograph template.
Fuel the Brain
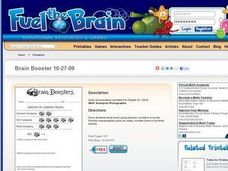
Interpret Pictographs
Have your youngsters use a graphic organizer and key to solve the following questions. By learning to interpret the pictographs, they will solve the problems accurately.
Curated OER
Picturing Hats
For this pictographs worksheet, students examine a pictograph then solve 11 problems related to the data in the pictograph. Students cross out problems that do not relate to the pictograph.
Curated OER
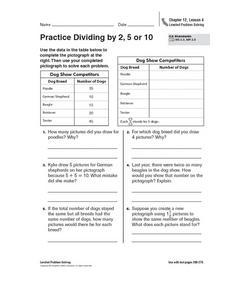
Practice Dividing by 2, 5, or 10
In this pictograph problem solving activity, students analyze the data on a table and create a pictograph. Students read and solve 6 story problems about the pictograph.


