Curated OER
Technology Literacy Challenge Grant Learning Unit
First graders explore counting and classification. They sort leaves, create graphs, write sentences for the data in the graphs, develop graphs for shapes, favorite animals, birthdays, and participate in a die prediction game.
Curated OER
Graphing Data
Second graders examine how to make and read bar graphs. In this bar graph lesson, 2nd graders compare bar graphs to pictographs by looking at hair color survey data. They practice making a bar graph and finding the range of the data.
Curated OER
Collecting Data and Graphing
Eighth graders, in groups, count the different colors of M&M's in each kind of package and then draw a pictograph to show the results. Each group writes a program to show their results and then compare the manually-drawn and computer...
Curated OER
Graphing Data
Second graders graph data about their classmates. For this data analysis lesson, 2nd graders ask each other several questions about their hair color and eye color. Students graph the data that they collected.
Curated OER
Organizing Data
In this organizing data learning exercise, 7th graders solve seven different types of problems related to data. They first identify the type of data as categorical, discrete or continuous from the information given. Then, students use...
Curated OER
Handling Data
Students create a simple table in order to solve a problem. As a class, they create a simple data table in order to discover the number of letters in each student's name. This data is interpreted in order to answer questions and make...
Curated OER
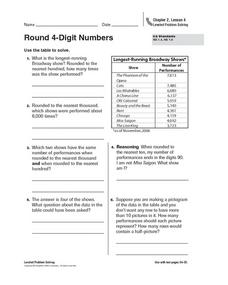
Round 4-Digit Numbers
In this rounding numbers practice worksheet, students sharpen their problem solving skills as they solve 6 story problems that require them to round 4-digit numbers.
Curated OER
Make Ten to Add
In this making ten worksheet, students learn to use pictographs or math tables to help them learn to make ten in addition word problems.
Curated OER
Statistics of Mars
Students explore the concept of central tendencies. In this central tendencies lesson, students sort M&M's or Skittles based on color. Students graph their results. Students find the mean, median, and mode of their data.
Curated OER
What's Data?
Students get the opportunity to investigate the concept of data collecting. They explore how to tally and read a bar graph. Vocabulary about data is also be included. At the end of the lesson, individual students collect data independently.
Curated OER
WHAT IS THE POPULAR COLOR?
Fourth graders graph cars according to their colors. They complete the graph including a title, scale, x-axis, and y-axis. Students collect the data and choose the type of graph to be made.
Curated OER
Introduction to Graphs
Students poll classmates to gather information for a graph. They identify three types of graphs (bar, line, table). Students create each type of graph using data gathered from classmates.
Curated OER
Telling Time to 5 Minutes
In this second grade lesson your class will practice telling time. The goal is to tell time to five minutes using an analog clock. Your young students count by 5 minute intervals and discuss elapsed time.
Curated OER
Graph the Results: Applesauce Taste Test
Students work together to make applesauce following specific directions. They taste each applesauce and graph the results based on the taste test. They also use the internet to create an online graph.
Curated OER
How Big Is Your Head?
Students explore measurement by measuring classmates' heads. They record their measurements and they put the measurements in order from smallest to largest. Students figure the mean, median, mode, maximum, minimum, and range of their...
Curated OER
All in the Family
Students use data to make a tally chart and a line plot. They find the maximum, minimum, range, median, and mode of the data. Following the video portion of the lesson plan, students will visit a Web site to test their data collection...
Curated OER
Usage and Interpretation of Graphs
Cooperative groups are formed for this graphing activity. Each group must construct a graph that represents how many eyelets (the holes for laces in shoes), are present in their group. A whole-class bar graph is eventually constructed...
Curated OER
Survey Savvy
Third graders design appropriate questions for a survey, survey classmates, create a pictograph to represent the results, and explain the survey results.
Curated OER
It's Your Choice
Students compare data and determine the appropriate way to organize the data. They use physical graphs, pictographs, and symbolic graphs to display their data. In addition, they complete a Venn diagram.
Curated OER
Picture Graphs
In this mathematics worksheet, students look at pictures and identify how many of each object is illustrated. Then they graph their results on the graph given. Students also draw tally marks to count how many faces are in the pictures.
Curated OER
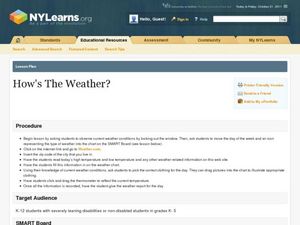
How's the Weather
"How's the Weather?" is an exercise that combines science and math as students graph the weather along the Iditarod Trail. They complete a double-line graph of the weather of a chosen checkpoint over the course of one week. Students...
Curated OER
Farm Census
Students disuss the work of a farmer. They recognize and name farm animals to represent the information in a pictogram.
Curated OER
Graph It
First graders collect classroom data (such as mode of transportation used to get to school) and prepare a pictograph to interpret the information.
Curated OER
Tracks are for Trains
Second graders collect data on different forms of transportation and create a bar graph or pictograph with the information.


