Curated OER
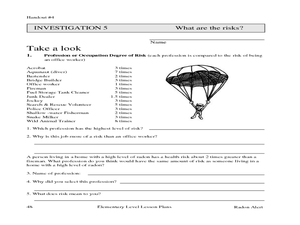
Radon Alert: Understanding Odds
In this radon alert: understanding odds worksheet, 5th graders predict results of rolling dice and record data in a chart, then compare odds of events and occupations, then compare that with radon exposure.
Curated OER
Rice and More Rice
Fifth graders explore problem solving strategies for mathematical estimation. In this math problem solving instructional activity, 5th graders predict how many grains of rice are in a jar, practice establishing and looking for patterns...
Curated OER
Baseball Math
Students collect data on baseball plays. In this statistics lesson, students graph their data and make predictions based on their observation. They calculate what the probability is that a favorable outcome would happen.
Curated OER
Making Parallel Lines
Students differentiate between parallel and perpendicular lines. In this geometry lesson, students make conjectures and apply it to solve real life situations. They collect data and make predictions based on the data.
Curated OER
Data and Probability: What is the Best Snack?
In this math/nutrition lesson, the nutritional value of 3 snack foods is recorded on a data chart and represented on a bar graph. Students analyze and compare information, construct data charts and related bar graphs, and draw...
NTTI
Line 'Em Up!
Coordinate planes and Cartesian graphing systems are the focus of this math lesson. Learners use video, internet activities, and engage in hands-on activities in order to explore coordinate planes. The materials needed for this lesson...
Curated OER
The Mitten
Explore the Ukraine through a reading of The Mitten. Readers will determine the sequence of events, cause and effect, make predictions, and find the main idea of the story. They also use math skills to make charts and graphs. Finally,...
Mathalicious
Pic Me!
Finally! Math and Instagram have come together to discuss the correlation between likes and followers. High schoolers can't help but want to discover what makes one account more popular than another by developing a line of best fit and...
Curated OER
Wacky Water World: Student Worksheet
This well-designed math worksheet invites learners to work in pairs in order to determine which plan is the better value when going to an amusement park. Plan A and Plan B each have different admission fees, and different rates per ride....
Curated OER
Probability Games and Activities, Unit 10
Looking for tangible ways to practice probability with your class? Through 4 activities, learners practice with experimental probability, using math to make educated guesses, then testing it through physically completing the experiment....
Curated OER
Hey, Pythagoras! Help Me Understand Your Theorem!
Learners explore the Pythagorean Theorem. In this math lesson plan, pupils solve problems using the Pythagorean Theorem. They select the appropriate numbers to substitute in the formula to solve problems.
Curated OER
Valentine Candy Count
Students analyze a bag of Valentine candy to create a graph. In this graphing lesson, students make predictions, sort by color, record data and make a graph. Students discuss results and make generalizations. Students generate their own...
Curated OER
Making Patterns - Create, Analyze, and Predict
Fourth graders practice making patterns using Unifix cubes and identify, analyze, and determine rules for describing numerical patterns involving operations and nonnumerical growing patterns. They also find an example of a pattern in...
Curated OER
Counting Crows
Students discuss the fable, The Crow and the Pitcher. In this literature instructional activity, students read the fable and create a crow sock puppet. Students use their puppets to dramatize the fable.
Curated OER
It Started as an Egg
Learners investigate animals that hatch from eggs. In this hatching animals lesson plan, students investigate which animals are born alive and which hatch from eggs. Learners read It Started As An Egg and practice reading comprehension...
Curated OER
Math Combinations
Young scholars examine how to use lists, tables, and tree diagrams to solve math combinations. They create various combinations of outfits using clothing manipulatives, watch an episode of the PBS series Cyberchase, and play an...
Curated OER
Making Paper
Students explore paper making. In this cross curriculum multicultural ecology and art lesson plan, students follow written and oral instructions to make paper using common household items. Students predict the amount of paper use in...
Texas Instruments
Math TODAY for TI-Navigator System - Is Leisure Time Really Shrinking?
High schoolers organize data from the USA TODAY Snapshot, "Is leisure time really shrinking?" into two scatter plots and determine the quadratic model for each scatter plot. They determine if these graphs intersect and learn the concept...
Curated OER
Conditions at Sea Introductory Activity, Making Waves
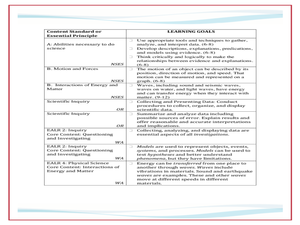
Students explore waves and wind. In this physical and earth science wave lesson, students participate in a wave making activity with an aquarium and a hair dryer. Students complete a data chart recording wave height and related factors....
Curated OER
Lines of Best Fit
Students explore the concept of line of best fit. In this line of best fit lesson, students find lines of best fit in examples about riding your bike home from school and dentistry. Students find two data points and find the line of best...
Curated OER
File Card Bridges
Students make different variations of file card bridges and predict how much weight it will hold. In this file card bridges lesson plan, students put file cards between books in different ways and predict how many pennies it will hold.
Curated OER
Lines of Best Fit
Students determine if there is an associationm in a scatter plot of data. They analyze data through predictios, comparisons, and applications. Students calculate the line of best fit using a graphing calculator. They display data in...
Curated OER
High Five Board Game
In this high five board game worksheet, 8th graders use the game board and instructions provided to create ordered pairs using dice and cubes, then analyze the probability and predict outcomes.
Curated OER
Picnic Possibilities
Fourth graders plan a picnic using weather data. Using accumulated weather data from various sources, they create a graph of the weather conditions in their region for a given period of time. Students interpret this data to predict the...
Other popular searches
- Making Predictions Math
- Pumpkin Math Predictions
- Prediction Math
- Predictions Math
- Prediction Skills in Math
- Tsunami Prediction Math


