Curated OER
Candy is Dandy
Students view the benefits of using graphs to communicate information, answer questions and solve problems. They investigate color distribution in bags of M & M's. Working with actual bags of candy, they will sort and classify contents.
Curated OER
What Is It?
Students explore the likelihood of events. In this logical thinking lesson, 3rd graders are given several scenarios and determine whether the possibility of the described event actually happening is likely, unlikely, or...
Curated OER
"M&Ms"® Candies Worksheet 1
In this math worksheet, students find the likelihood of different outcomes with the use of M and M's candy for the seven questions and fill in the graphic organizer.
Curated OER
Here Comes the Sun
Third graders watch a video on the solar system and examine the role of the sun. As a class, they complete a KWL chart and make different color temperature pockets to use during their experiment. In groups, they make predictions about...
Curated OER
Geometry- Hands and Feet
Learners identify units of measurement. In this measurement instructional activity, students predict the length and width of their hands and feet. Learners discuss their findings and if their predictions were correct.
Curated OER
Population Pyramids
Young scholars utilize population pyramids to answer questions, make comparisons, draw conclusions and support predictions about the populations of China, India and the Unites States. They arrange numbers and symbolic information from...
Curated OER
Five Second Dash
Students estimate how far they can run, jump, or hop in five seconds, then check their prediction. In this estimation lesson, student predict how far they can run, hop, or jump in five seconds and then try it.
Curated OER
Coin Count & Classification
Students make a prediction about how 100 pennies sort by decade or year and then test their predictions. They organize their data using a graph that is imbedded in this lesson.
Curated OER
Leveled Problem Solving: Experimental Probability
In this using probability to solve word problems worksheet, students use statistics, averages, and even numbers, to problem solve. Students solve six problems.
Curated OER
Celebrating the Fourth of July!
Students model projectile motion algebraically and graphically; and make predictions based on the quadratic algebraic model.
Curated OER
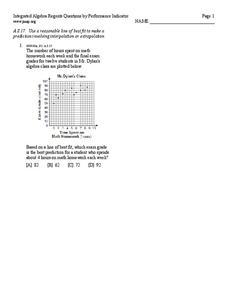
Line of best fit
In this Algebra I/Algebra II worksheet, students determine the line of best fit for a scatter plot and use the information to make predictions involving interpolation or extrapolation. The one page worksheet contains one multiple...
Curated OER
One Good Turn Deserves Another
Young scholars make observations about shapes and 1-, 2-, and 3-dimensional objects. They conduct observations and make predictions regarding transformations of simple geometric shapes. They identify shapes that occur in household items.
Curated OER
Using Data to Determine the Location of the Stiffest Opposition to School Desegregation in the 1970's
High schoolers analyze historical data. In this school desegregation lesson, students make predictions about opposition to desegregation, examine the provided desegregation data, and determine if their predictions were correct.
Curated OER
What Does Time Have to Do with it?
Students investigate time. In this investigative lesson, students run through an obstacle course using standard timers. They record the time and apply this knowledge to problems in math. Students record their predictions, and graph...
Curated OER
Here's the Pitch
Young scholars define pitch, measure varying amounts of water into containers, make predictions about the sounds made when striking the containers, put containers in order from highest to lowest pitch, and create their own sound patterns...
Curated OER
Compared to What? Comparing the Density of Different Liquids
Students work in groups to compare the density of different liquids. In this density lesson, students use cooking oil, liquid detergent and water to measure density. Students record their results and check the accuracy of...
Curated OER
Comparing Data on Graph A and Graph B
Second graders gather and graph data. In this graphing lesson plan, 2nd graders collect data and graph this information using tally charts, bar graphs, pictographs, or tables. They make predictions about the outcomes.
Curated OER
Extraordinary Extrapolation
Students study how scientists have estimated the maximum height to which trees can grow, and assess the reliability of interpolation and extrapolation techniques by making predictions with particular data sets and analyzing accuracy of...
Texas Instruments
Transformational Puppet
High Schoolers create a puppet and make predictions using the TI Navigator. In this math lesson, they will discuss their results as they explore transformation. This assignment requires the TI navigator or a smartboard.
Curated OER
What's My Pattern?
Students recognize, describe and extend patterns in three activities. They organize data, find patterns and describe the rule for the pattern as well as use the graphing calculator to graph the data to make and test predictions. In the...
Curated OER
Weather, Data, Graphs and Maps
Students collect data on the weather, graph and analyze it. In this algebra instructional activity, students interpret maps and are able to better plan their days based on the weather reading. They make predictions based on the type of...
Curated OER
Probability and Expected Value
Students collect data and analyze it. In this statistics lesson plan, students make predictions using different outcomes of trials.
Curated OER
Lego Robotics: Measuring Speed
Students build and program a LEGO robotic car as well as measure and graph its speed. They acquire familiarity with principles of construction, motion, design and problem solving. They compare a robot's speed over two different surfaces...
Curated OER
Let the Weather Help You Dress
Students observe weather daily for at least a month and graph the weather for one month. Then they use weather vocabulary such as sunny, windy, rainy, stormy, cold, snowy, foggy, and hot, and share their predictions about weather. ...
Other popular searches
- Making Predictions Math
- Pumpkin Math Predictions
- Prediction Math
- Predictions Math
- Prediction Skills in Math
- Tsunami Prediction Math


