Curated OER
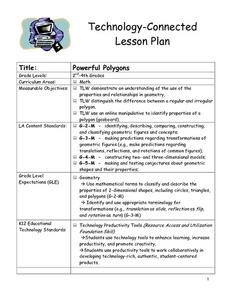
Powerful Polygons
Students scan the classroom to find different common shapes. They listen as the teacher defines polygon and regular polygon. The teacher demonstrates regular polygons via the Internet and the "Math is Fun" web site. Students go outside...
Curated OER
Spaghetti Graphs
Students work in pairs to test the strength of spaghetti strands. They collect and graph data to determine a line of best fit. Students create a linear equation to interpret their data. Based on the data collected, students predict...
Curated OER
Roll or Slide?
Students explore models of three-dimensional shapes. In this geometric shapes lesson, students use hands-on manipulatives to explore three-dimensional shapes. Students predict whether each shape will roll or slide.
Curated OER
Cars on the Curve
Second graders, using two dice, participate in a car race game called Cars on the Curve. They predict which car wins the game and records it in their Data Diary.
Curated OER
Rep Tiles
Third graders use pattern blocks of one shape at a time to try to create a similar shape. They compare the perimeter of the new figure with the perimeter of the original shape and look for a pattern. Students use the pattern to predict...
Curated OER
I'm Warm Now
Third graders graph how much water is wasted while waiting for it to get warm in the spigot in the sink. In this graphing lesson plan, student first predict how much water is wasted. That night they test it out at home and the next day...
Curated OER
Let's Talk Trash
In this solid waste worksheet, learners classify the different types of solid wastes found in landfills into given categories. Students predict and tally the total number of each type of item found in the landfill using slips of paper....
Curated OER
Picking Pythagoras
Students discover that side measurement is used in determining angle classification of a triangle. By squaring sides, they predict whether triangles be right, obtuse, or acute. They prove the Pythagorean Theorem and use it to solve...
Curated OER
Can I have a Pet?
Students read the book Can I have a Pet?, by Gwendolyn Hudson Hooks. They determine which animals the main character asked to have as a pet, explain why zoo animals do not make good pets, and study the pictures to make predictions.
Curated OER
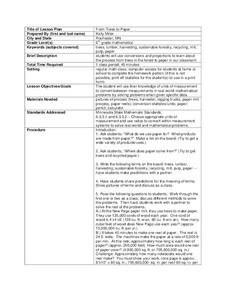
From Trees to Paper
Sixth graders investigate logging and the process of paper making. In this forestry lesson, 6th graders analyze pictures of trees being processed into the paper they use everyday. Students solve and create math problems based...
Curated OER
Electricity: Will It Conduct?
Students build conductivity testers and investigate which solids and solutions conduct electricity. Working in groups, they predict which items will conduct electricity and record their answers on worksheets.
Curated OER
Grade 1: More Land or Water?
First graders listen as the teacher reads a story involving cross-continent traveling. Students collect a random sample by tossing an inflatable globe and recording whether they touch land or water each time they catch the globe in order...
Curated OER
The Magic Pot
Second graders complete activities with the book The Magic Pot. In this comprehension lesson, 2nd graders read the story, answer comprehension questions, and create a storyboard. They also complete Magic Pot math by working on...
Curated OER
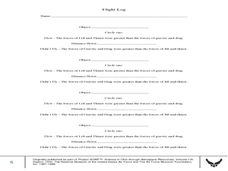
Household Things that Fly and Why!!!
Students examine the four forces of flight. In this flight instructional activity, students test to see which types of items will fly. Students make predictions on whether the item will fly or not. Students gain knowledge about lift,...
Curated OER
Strike a Pose: Modeling in the Real World (There's Nothing to It!)
Adjust this lesson to fit either beginning or more advanced learners. Build a scatter plot, determine appropriate model (linear, quadratic, exponential), and then extend to evaluate the model with residuals. This problem uses real-world...
Curated OER
One, Two, Three...and They're Off
Students make origami frogs to race. After the race they measure the distance raced, collect the data, enter it into a chart. They then find the mean, median, and mode of the data. Next, students enter this data into Excel at which time...
Curated OER
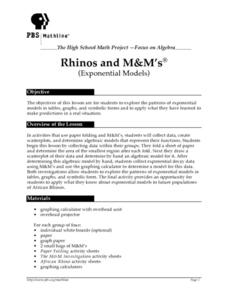
Rhinos and M&M's
Students analyze patterns of exponential models by collecting data in paper folding and M&M investigations. They use graphing calculators to create scatter plots that lead to equations for the exponential models. They then apply this...
Curated OER
Teaching and Learning Through Objects
Students identify and interpret the function, usefulness or utitlity, form, beauty or aesthetics, and meaning, context or story, of objects and how they learn new skills and make things that they learn traditionally, by observation and...
Curated OER
The Bio-fuel Project: Creating Bio-diesel
Students investigate bio-fuel. In this investigative lesson, students create bio-fuel from vegetable oil waste. Students will analyze, predict, collect and synthesize data from their experiments with bio-fuel.
Curated OER
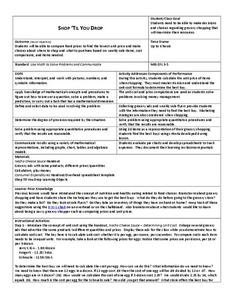
Shop 'Til You Drop
Students compare food prices to find the lowest unit price and make choices about where to shop and what to purchase on weekly items, cost comparisons and items needed. They collect grocery ads and weekly sale flyer's to expedite their...
Curated OER
How Much Ocean?
In this ocean worksheet, students are given a map of the world and they predict the amount of water that covers the Earth's surface. They count the total number of squares on the given map that represent the water and they land and they...
Curated OER
Shop 'Til You Drop
Young scholars evaluate food prices. In this real world math lesson plan, students compare the cost of various grocery items to determine which is the best deal. They work in groups using grocery ads to decide how to get the most product...
Curated OER
Good News - We're on the Rise!
Students build and observe a simple aneroid barometer to discover changes in barometric pressure and weather forecasting. They graph changes in barometric pressure for two weeks and make weather predictions.
Curated OER
Counting Chart
Elementary learners discover counting through a counting chart. In this math instructional activity, learners identify numbers 1-100. They then point or recite their counting numbers.
Other popular searches
- Making Predictions Math
- Pumpkin Math Predictions
- Prediction Math
- Predictions Math
- Prediction Skills in Math
- Tsunami Prediction Math


