Curated OER
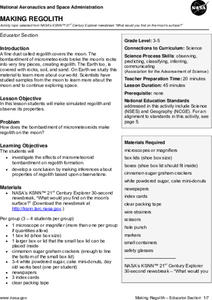
Making Regolith
You may not be able to take a field trip to the moon, but that doesn't mean your class can't study moon rocks. Using graham crackers as the moon's bedrock and powdered donuts as micrometeorites, young scientists simulate...
Curated OER
Magnets and Interactions
Second graders discover what magnets can do. In this magnet lesson students make predictions about magnets. They experiment with the magnets and record their data on a chart.
Curated OER
Fall Leaves Fall! Lesson Plan
Students discover facts about leaves. In this early childhood lesson plan, students identify different types of leaves, and make predictions about which types of leaves they think they will find in their community. Students collect...
Curated OER
Probability with Number Cubes
Second graders make sampling predictions, predict outcomes and explore probability through experimentation.
Curated OER
Using Extrapolations
In this using extrapolations worksheet, 6th graders use data analysis to answer nine questions about data prediction and extrapolation.
David Pleacher
Candy Math Fun
Few things can motivate children to learn like the promise of a sweet and tasty treat. Given a bag of M&M®s, Skittles®, or other colorful candy, students first predict the contents of the bag before counting the pieces,...
Curated OER
Multi-dimensional Modeling of Ore Bodies Making Sense of Empirical Data
Math scholars identify four different rock types in that strata and use this identification and data to construct a two dimensional geologic cross-section. They use data tables to construct a three-dimensional geologic cross-section.
Balanced Assessment
Monitor Pricing
Out with the old and in with the new. Learners use a set of prices of computer monitors from 1994 to make a prediction. They then use one current price and what they know about the old prices to make a more recent prediction. Their...
Curated OER
Math On the Job
Investigate different types of math required for specific jobs. In this math in occupations lesson, use the Internet to research what type of math one might need to know in order to be successful in different jobs. Complete a...
Education Development Center
Geography of the Coordinate Plane
Put the graph into graphing and allow learners to understand the concept of point plotting and how it relates to data. The worksheet provides a nice way to connect data analysis to a graph and make predictions. The worksheets within...
101 Questions
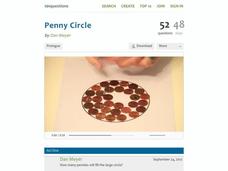
Penny Circle
Watch as your classes buy into a rich lesson full of information. A video opener challenges individuals to determine the number of pennies that fit in a circle with a 22-inch diameter. Using lesson materials, scholars collect data and...
101 Questions
Angry Bird Quadratics
Launch your classes into a modeling lesson. Young scholars watch angry bird trajectories and make predictions based on their knowledge of quadratic functions. The lesson includes a series of questioning strategies to lead learners to the...
101 Questions
Suitcase Circle
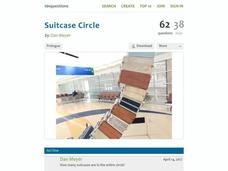
Analyze patterns in a circular arrangement. After using a geometric construction to complete a circle, learners use proportional reasoning to make predictions. By determining the length of an arc built from suitcases, they estimate the...
101 Questions
Snow Day
Who doesn't like a snow day? Learners watch a snow accumulation over a span of 10 hours. They use that information to make a prediction of the total snow that fell during the 23-hour snowfall. Will it be enough to cancel school?
5280 Math
Interesting Times
Gain a little interest in functions with a real-life task. Young scholars analyze home loan data with a geometric sequence and series. They use the models to make predictions about the total loan payments at certain intervals in a...
Radford University
Can I Create a Line/Curve of Best Fit to Model Water Drainage?
Learners collect data on the amount of water left in a bottle over time. They graph the data to determine whether the scatter plot shows a curved or straight relationship. Group members then determine an equation for the curve of best...
Curated OER
Candy is Dandy
Students investigate color distribution in bags of M&Ms They sort and classify the contents of a bag of M&Ms and summarize their findings on a worksheet. Students convert the numbers into charts and make predictions about color...
Curated OER
Do You Feel Lucky?
Students calculate simple probabilities using mathematics then roll dice to test their predictions.
Curated OER
Advanced Algebra: Do You Feel Lucky?
Young scholars explore the realm of mathematical probability while playing a game of chance. after constructing paper rockets, they fire it enough times to determine the probabilities of the rocket traveling past a marked distance and...
Curated OER
Predicting the Future
Students examine how scientists predict the effects of global climate change. In this environmental science lesson, students participate in a discussion about using computer generated data to create climate predictions. Students examine...
Curated OER
Make a Pass at Me
Learners identify different types of functions and units of measurements. In this statistics lesson plan, students will collect data, graph their data and make predictions about their data. They plot a linear regression graph.
Curated OER
Use Information in Line, Bar, Circle, and Picture Graphs to Make Comparisons and Predictions
Eighth graders explore the concept of graphs. In this graphs instructional activity, 8th graders compare and contrast picture graphs, bar graphs, line graphs, and circle graphs. Students examine each type of graph and answer questions...
Curated OER
Weather Watchers
Students identify basic weather instruments and how they are used to record weather data. Students define several vocabulary terms as stated in lesson. Students use basic instruments to record weather data in their area. Students use the...
EngageNY
Determining the Equation of a Line Fit to Data
What makes a good best-fit line? In the 10th part of a 16-part module, scholars learn how to analyze trend lines to choose the best fit, and to write equations for best-fit lines to make predictions.
Other popular searches
- Making Predictions Math
- Pumpkin Math Predictions
- Prediction Math
- Predictions Math
- Prediction Skills in Math
- Tsunami Prediction Math


