Curated OER
Family TV
In this family TV worksheet, young scholars study, examine and make predictions about several television shows, collect data and then chart their data collected.
Virginia Department of Education
Quadratic Curve of Best Fit
Class members create a table of the number of chords that can be drawn given the number of points on a circle. Pupils analyze the data created, find a function to fit to it, and use the function to make further predictions.
Curated OER
Line of Best Fit
In this line of best fit activity, students solve and complete 8 different problems that include plotting and creating their own lines of best fit on a graph. First, they study the samples at the top and plot the ordered pairs given on...
Regents Prep
Activity to Show Sample Population and Bias
There is bias in many aspects of our lives, and math is no exception! Learners explore provided data to understand the meaning of biased and random samples. The resource includes various data sets from the same population, and...
Curated OER
Measuring Area: Sensible Flats
Here's how to calculate the areas of polygonal figures. In this measuring area lesson, upper graders use hash marks to create and count square units. They also problem solve a cyberchase activity watching Quicktime videos.
Under the Dome
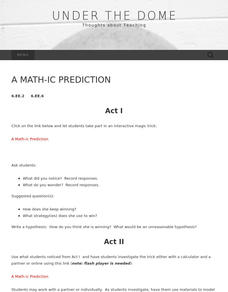
A Math-ic Prediction
Trick out mathematical expressions. Scholars participate in a computerized magic trick where the computer guesses the final answer to a series of operations. Pupils investigate the trick to determine what is happening. Individuals then...
101 Questions
Toilet Paper Roll
You won't want to flush a great lesson down the drain! An intriguing resource asks learners to predict the number of sheets of toilet paper on a roll. Presented with the dimensions of the roll and one sheet of paper, scholars make...
Shodor Education Foundation
Racing Game with One Die
Pupils roll a die to figure out which car advances on a race track. They determine the rules for each car moving forward and, given the statistics of the winner, compare if it matches their predictions.
Curated OER
"Lucky Charms": Interpreting Data and Making Predictions
Seventh graders determine if a "lucky charm" will increase their chances of winning a game. Students calculate the experimental probability of each player in a game. They observe and collect data from each activity. Students compare the...
Curated OER
More, Less, and Equally Likely
For this math making predictions worksheet, students solve 3 math word problems that require them to make predictions based on the information presented.
Curated OER
M&M Science and Math
A series of math and science activities feature M&M's® as manipulatives to help kids work through equations. The resource includes exercises on finding averages, percent of compositions, moles in chemical reactions, genotypes and...
Radford University
Regression Analysis Activity
Don't let your knowledge of regression analysis regress. Pupils take part in three activities to learn about regression curves. They research and collect data to predict how long it will take a basketball to hit the ground, find a...
American Statistical Association
Spinners at the School Carnival (Equal Sections)
Spin to win a toy car. A fun activity has pupils use a spinner in which three of the equal sections represent winning a toy car, and the fourth section represents no car. They record the number of wins after certain numbers of spins,...
Bowland
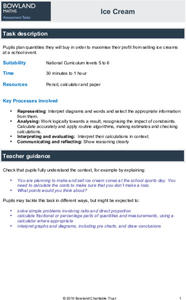
Ice Cream
Make sure there is enough ice cream on hand. Learners try to find out how much ice cream to buy for a sports event. Scholars use a pie chart showing the percent of a sample of people who like different flavors of ice cream. Using the...
Curated OER
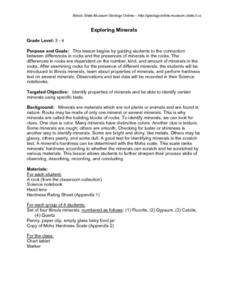
Exploring Minerals
I love this geology lesson plan. Third and fourth graders look at the connections, and the differences, between rocks and minerals. Learners are charged with identifying specific rocks and minerals, learning how to properly use...
Curated OER
Gummy Bear Math
First graders predict, collect data, and create a graph based on gummy bear colors they are given. In this graphing lesson plan, 1st graders first predict how many colors of gummy bears there are. They then count the colors, graph them,...
Curated OER
Let's Make a Compost Cake
Students create a compost cake. For this gardening and decomposition science lesson, students review and describe the "nutrient cycle." Students create a compost pile, measure and record the dimensions and temperature of the pile, and...
Curated OER
Piles of Paper
Track how much paper their class uses in a week. They will pile their used paper into one place, each day the pile is measured. They make predictions about how much paper they would collect in a month, then recycle the paper.
Curated OER
Linear and Quadratic Model, Data Modeling
High schoolers model quadratic and linear equations. In this algebra lesson plan, students solve word problems using equations. They create scatter plots and make predictions using correlations.
Curated OER
How Long Can You Go?
Eighth graders examine the usefulness of a line of best fit by collecting and graphing data, using a graphing calculator to determine the line of best fit, and making a variety of predictions. They watch a video, then design a...
Annenberg Foundation
Skeeters Are Overrunning the World
Skeeters are used to model linear and exponential population growth in a wonderfully organized lesson plan including teachers' and students' notes, an assignment, graphs, tables, and equations. Filled with constant deep-reaching...
Curated OER
Data Analysis and Probability: Graphing Candy with Excel
Collect and graph data using Microsoft Excel with your math class. They will make predictions about the number of each colored candy in a bag of M&M's, then sort, classify, count, and record the actual data before using Excel to...
Curated OER
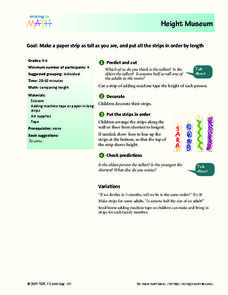
Height Museum
Here is an engaging instructional activity which invites learners to cut a strip of adding machine tape that is their height. They decorate their strip, arrange the strips from shortest to longest, and then discuss predictions.
Curated OER
Using Random Sampling to Draw Inferences
Emerging statisticians develop the ability to make inferences from sample data while also working on proportional relationships in general. Here, young learners examine samples for bias, and then use random samples to make...
Other popular searches
- Making Predictions Math
- Pumpkin Math Predictions
- Prediction Math
- Predictions Math
- Prediction Skills in Math
- Tsunami Prediction Math


