Teach Engineering
Magnetic or Not?
The class must determine the magnetic properties of different materials, including aluminum and steel by sorting through materials using a magnet. Groups make a prediction on whether a material is magnetic and then perform...
Virginia Department of Education
May I Have Fries with That?
Not all pie graphs are about pies. The class conducts a survey on favorite fast food categories in a lesson on data representation. Pupils use the results to create a circle graph.
Beyond Benign
The Big Melt: Arctic Ice Caps
Are the Arctic ice caps really melting out of existence? Junior climatologists examine the statistics of ice decline through four math-based lessons. Each activity incorporates data, climate information, and environmental impact into an...
Curated OER
Bar Graphs and Survey Questions- Internet Access
In this graphing and data collection activity, students examine a bar chart that show data collected from 1998 - 2006 that shows the percentage of households that have Internet access. They answer questions based on the chart and make...
EngageNY
Modeling a Context from Data (part 1)
While creating models from data, pupils make decisions about precision. Exercises are provided that require linear, quadratic, or exponential models based upon the desired precision.
EngageNY
Tides, Sound Waves, and Stock Markets
Help pupils see the world through the eyes of a mathematician. As they examine tide patterns, sound waves, and stock market patterns using trigonometric functions, learners create scatter plots and write best-fit functions.
101 Questions
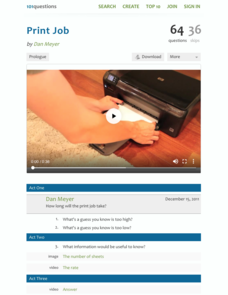
Print Job
A watched printer never finishes—or does it? Engage your classes in a ratio and proportion task that asks them to predict how long it takes to print the numbers one through 88 on 88 sheets of paper. They use video to determine the rate...
GeoGebra
Getting on the Right Wavelength
Predict an equation that waves up and down. Pupils set the height, radius, and period of a Ferris wheel. The learners write a sine equation to match the graph of the height of a point on the wheel as a function of time. Running the...
Curated OER
Probability and Statistics
Elementary schoolers choose from a host of activities to investigate probability and statistics. They complete worksheets, create 3-D graphs, and play graph bingo. They make weather predictions and list all the possibilities before going...
Curated OER
Matrix Operations
Two real-world activities to practice adding, subtracting and multiplying matrices to problem solve. Data from several Pro football quarterbacks is used in one activity to make some predictions based on their stats. Then the class takes...
Achieve
Spread of Disease
Viruses can spread like wildfire, and mathematics can model the speed of infection. Given a function, scholars analyze it to describe the spread of a disease within a stadium. Learners find the initial number infected and the maximum...
PBL Pathways
Cell Phones
Calling all subscribers! Model revenue based on individual cell phone subscribers. The project-based learning activity presents a challenge to scholars from a cell phone company. Individuals model data provided to them from the company...
101 Questions
Pixel Pattern
Any vintage video game users in the room? Young scholars use a video presentation to analyze patterns in pixel arrangements. By writing an arithmetic sequence, they make predictions about the size of the image.
Radford University
Corn and Popcorn
Have a popping good time. Using probability and statistics skills, learners determine which type of popcorn to buy based on the percentage of kernels popped. After analyzing corn and popcorn sales to make a prediction of future sales,...
Radford University
Population Project
How fast does it grow? Scholars work on two tasks dealing with exponential growth, one on population growth and the second on investments. Learners research a country's population over the past century and make predictions of the current...
US Department of Commerce
Diversity: Languages Spoken in the United States
High schoolers begin a discussion on diversity and determine the percent of the population that speak another language at home in the US. Classmates make a prediction of the percentage of people that speak another language at home in...
Radford University
Got Slope?
Go around and around with slope. The class investigates tornadoes by watching videos, building a homemade tornado, and performing research on the Storm Prediction Center website. Groups gather data and create scatter plots for twisters...
Curated OER
Rain and Lightning
What are the chances that there will be rain and lighting today? Use this activity to study independent and dependent probabilities with your class. Learners explore the differences between P(A and B) and P(A or B) using mock...
CK-12 Foundation
Simple Random Sampling: How Many Samples Does it Take to Change a Light Bulb?
Teach the concept of simple random sampling through an interactive lesson. Learners explore the concept by considering the strength of sampling methods. Size of the samples varies also as individuals determine which methods lead to the...
Curated OER
Identify Prime and Composite Numbers
Fourth and fifth graders identify numbers as prime or composite, list composite numbers that could be mistaken for prime and answer a "prediction" question.
Curated OER
Looking Ahead: Writing Prompt
This writing prompt spans nine slides and encourages learners to discuss or write about how they feel about moving on to 5th grade. It is a great way to engage self-assessment, reflection, personal motivation, and fluid writing skills.
Curated OER
Get Geared Up
Middle schoolers calculate gear ratio as they solve word problems. They discuss and find slopes as they relate to real life. Additionally, they hey use ratio and proportion to make predictions and solve problems.
Curated OER
M&M Math
Students sort a bag of M&M candies according to color using a sorting mat. They count M&M candies. They compare the number to their prediction then students create tally charts.
Texas Instruments
Making Predictions Using Systems of Equations
Students explore the concept of systems of equations. In this system of equations lesson, students enter data into lists on their calculators about 100 meter dash times. Students plot the points using a scatter plot and perform a linear...
Other popular searches
- Making Predictions Math
- Pumpkin Math Predictions
- Prediction Math
- Predictions Math
- Prediction Skills in Math
- Tsunami Prediction Math


