Curated OER
Time-Axis Fallacy and Bayes Theorem
Young scholars determine that knowledge of an event's outcome can affect the probability of the unknown outcome of an event that has already occurred.
Curated OER
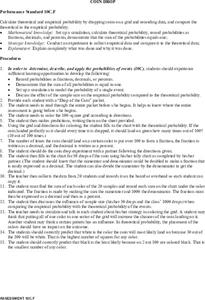
Coin Drop
Students calculate the theoretical and empirical probability by dropping coins on a grid. They record their data and compare the theoretical and empirical data. Students make predictions about the results before conducting the experiment.
Curated OER
Matching Pairs
Young scholars examine the probability of the various findings in a game and determine the odds of winning. They differentiate between the facts of odds versus probability. Students use higher order thinking skills to explain how a...
Curated OER
Flip a Coin
Students are introduced to the concept of probability. In groups, they make a prediction about how many times a coin might show heads or tails when flipped. They carry out the experiment and record their results to compare it to their...
Curated OER
Guess the Color
Pupils draw colored blocks from a bag and determine the probability of each color being drawn. Then they draw blocks from another bag in which the numbers of each color are unknown. They guess the number of each color included in the...
Curated OER
Data Analysis, Probability, and Discrete Math: Lesson 5
Eighth graders are read the material that is printed in boldface type inside the boxes. Information in regular type inside the boxes and all information outside the boxes should not be read to them. They then find the mean, median,...
Curated OER
Musher Graphing and Probability
Students use the internet to research statistical information on the musher dogs participating in the Iditarod. Using the data, they create three different types of pie charts. They use the charts to answer questions about the dogs. They...
Curated OER
Variations on a Human Face Lab
Ninth graders gain an application level understanding of probability, symmetry, and ratios and rates that exists in one's everyday environment relative to human genetics.
Curated OER
Charts and Graphs
Fifth graders interpret data into graphs and percentages. In this organizing data lesson, 5th graders discuss bar, circle and line graphs. Students complete bar graph and apply probability using the results.
Curated OER
Pascal's Triangle
In this geometry lesson plan, 10th graders investigate Pascal's Triangles as they relate it to probability problems and geometric problems. They review the theories behind the formulas.
Curated OER
NUMB3RS Activity: Regular Ploygon Centroids
Students investigate geo-profiling. In this secondary mathematics lesson, students use geo-profiling to determine the most probable location of a criminal. Students find the centroid of a polygon where the vertices represent...
Curated OER
Least Common Multiples
In this math worksheet, students find the least common multiple of sets of numbers. Students factor each number to their prime factorization. They use the primes to find the least common multiples. This is a worksheet generator, the...
Curated OER
Data Analysis, Probability, and Discrete Math: Line Graphs
Eighth graders analyze data from line graphs. They discuss the purpose of line graphs, identify the parts of a line graph, answer questions about various graphs, and complete a worksheet. This lesson plan includes a script to teach...
Curated OER
"The Giver" by Lois Lowry
Middle schoolers predict results, design a model, and carry out trials to determine probability based on their experimentation.
Curated OER
"My Little Sister Ate One Hare" by Bill Grossman
Students understand, use, and compute basic probability.
Curated OER
What Are The Chances
Students calculate the probability of an event occurring. In this probability lesson, students differentiate between independent, dependent or compound events. They find the range of the data.
Other popular searches
- Fun Math Probability Games
- Probability/math Literature
- Smart Board Math Probability
- Grade 1 Math Probability
- Math Probability Vocabulary
- Math Probability Worksheets
- Sport Math Probability
- Math Probability Factorial
- Math Probability Games
- Grade 4 Math Probability
- Math Probability Lessons
- Probability and Sports Math


