Virginia Department of Education
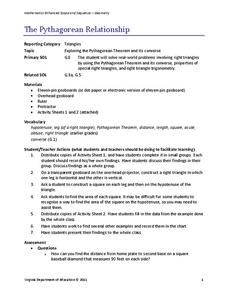
The Pythagorean Relationship
Add up areas of squares to discover the pythagorean relationship. Small groups create right triangles with squares along each side. They calculate the areas of each square and notice the relationship. Groups construct other types of...
Curated OER
Explore: Collect And Organize Data
In this exploring how to collect and organize data worksheet, young scholars, working with a partner, problem solve the answers to seven word problems involving data.
Curated OER
Strange Elevators: Creating and Extending Patterns
Second graders solve problems by recognizing patterns, creating patterns and extending them. They compare and contrast patterns.
Curated OER
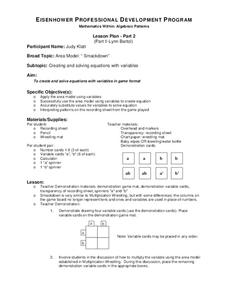
Mathematics Within: Algebraic Patterns
Students analyze problem solving techniques for equations with variables by playing a game called "Smackdown". They place variable cards on a grid and use the area model to calculate an answer after spinning a game piece to determine the...
Curated OER
Skiers on the Slope
Students explore mathematical concepts, problem solving, and the ability to program in LOGO to test ideas about speed, acceleration, gravity, and slope when dealing with downhill skiing.
Pennsylvania Department of Education
Freckle Face
Students collect and record data. In this early data analysis lesson, students gather data about their partners face. As a class, the students use tally marks and pictographs to record the data and answer question about the information...
Curated OER
How Much Will I Spend On Gas?
Students construct a linear graph. In this graphing lesson, students determine a monthly budget for gasoline. Students construct a t-chart and coordinate graph to display data. Resources are provided.
Curated OER
Party Time
Students explore the cost of a party. In this math instructional activity, students plan a party and determine the cost of hosting a party. Students use information from grocery stores to determine the unit cost of items for the party.
Curated OER
Creating Line Graphs
Learners draw line graphs. For this math lesson, students interpret minimum wage data and graph the data in a line graph. Learners predict the next minimum wage and figure the earnings for a 40 hour work week for someone earning the...
Curated OER
Nautical Navigation
Middle schoolers work together to discover the importance of charts while navigating. They complete a worksheet and practice reading maps. They create their own nautical chart to complete the activity.
Curated OER
Walk-a-thon
Fifth graders solve word problems. In this math lesson, 5th graders read the word problem and determine what is being asked. Students solve the problem and explain how they reached their solution.
Curated OER
A Thanksgiving Survey
Students conduct a survey. In this math lesson, students design and conduct a survey about Thanksgiving foods. Students display the collected data in a graph and use the graph to determine what food to serve for a Thanksgiving meal.
Curated OER
Add & Subtract Fractions w/Unlike Denominators, 2
Students use several examples to create a method for adding and subtracting fractions with unlike denominators. They present these methods to the class and then practice applying methods to sample problems.
Curated OER
Hurricane Tracking
Students access the Internet to find information on current hurricanes. They get locations, speeds, and air pressures and then plot the location of the hurricane on a hurricane-tracking map. They also access the FEMA website to solve...
Curated OER
Drip, Drip, Drip or The Case of the Leaky Faucet
Students explore the cost of wasted water. In this math lesson, students conduct an experiment in which they collect data on how much water is lost when a faucet leaks. Students figure the cost of the water that was wasted.
Curated OER
Fractions
Fourth graders explore fractions. They use Skittles and M&M's to practice adding and subtracting fractions. Students review the numerator and the denominator of fractions. They count the number of each color of Skittles and M&M's...
Curated OER
Metric Conversion
Seventh graders convert within the metric system of measurement. In this seventh grade math/science instructional activity, 7th graders view a PowerPoint presentation that introduces metric conversion. Students use the Stair-step...
Curated OER
Egyptian Weather Lesson
Learners chart temperatures in Egypt on spreadsheet to determine how weather conditions affect lifestyles.
Curated OER
Working With Pattern Blocks
Fifth graders solve mathematical problems using manipulatives in this math lesson for the fifth grade classroom. Various activities are suggested for lesson implementation making this lesson highly adaptable to fit the needs of the...
Curated OER
Credit: Taking an Interest in Credit
Students examine how credit works but looking at how credit cards and interest rates work. They use percentages to solve problems using credit card interest rates while completing a worksheets.
Curated OER
Place Value
First graders practice place value by completing problems that allow them to group 10 items together to create groups of 10 and see what is left over. In this place value lesson plan, 1st graders use cups to put 10 items in them, and...
Curated OER
Go Fish!
Eighth graders use goldfish crackers to simulate a capture-recapture method of data collection. They fill in a chart and determine the averages. They find the estimated population of fish and the actual population of fish based on the...
Curated OER
Cereal Box Blocks and More!
Students sort and categorize different types of boxes and cartons. In this sorting lesson, students designate areas of the room to put different sizes, styles, or colors of boxes. They help their teacher count and graph the different...
Curated OER
The Fuelish Fact Finding
Students define fluctuation and the price of food. In this algebra lesson, students create a budget to live on based on their living expenses. They create a chart and explore the cause and effect of real life scenarios.


