Curated OER
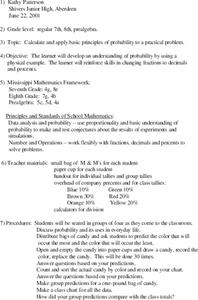
Probability using M & M's
Using M & M's candies, young statisticians predict the color distribution in a packet of candies and test their predictions against their group and the larger class. A review of converting between fractions, decimals, and percents...
Curated OER
Missing Factors
Students explore factors. They discuss factors, factor trees and prime factors. Students practice working with and finding various factors and prime factors. They discuss methods used to find factors.
Curated OER
Perimeter All Around
Students explore perimeter and area of regular and irregular polygons. They experiment with color squares and create different arrangements using the same number squares. Then they compare the area and perimeter measurements of each.
Curated OER
Property Lists for Quadrilaterals
Young scholars establish classifications of shapes by various properties (angles, sides, etc.). They introduce the important properties of common shapes. Students develop an awareness of the wide variety of ways the 2-D shapes can be alike.
Curated OER
Does Sunlight Effect Leaf Size?
Students make estimates and then measure leaves for accuracy. They calculate the area of the leaves by drawing an outline on graph paper and counting the squares. They compare the leaves exposed to sunlight to those that are in constant...
Curated OER
Interpreting and Displaying Sets of Data
Students explore the concept of interpreting data. In this interpreting data lesson, students make a line plot of themselves according to the number of cubes they can hold in their hand. Students create their own data to graph and...
Curated OER
Explorations in Measurement
Students define length and area. They identify materials that can be measured with a rule and yardstick. They measure length and area when given an object.
Curated OER
Time Management
Young scholars record their daily activities and graph the results using the educational software program called Inspiration. This lesson is intended for the upper-elementary classroom and includes resource links and activity extensions.
Curated OER
Complexity Madness
After introducing the concept and formula for finding the area of a square, try this lesson. Fifth graders will use their prior knowledge to break apart various shapes in order to determine area. This lesson includes several examples,...
Curated OER
What Is Money?
Young scholars discuss the difference between earned and unearned income. They use addition, subtraction, multiplication, and division (with whole numbers, fractions, decimals and/or percents, mixed numbers) to solve real-world math...
Curated OER
Multiplication
Fourth graders write down multiplication facts that are given orally by the teacher and then place playing pieces on the correct number of a bingo chart when a multiplication fact is stated. The winner is the one to fill a row...
Curated OER
Savings
Students investigate the different ways to save money and the reasons for doing so. They use addition, subtraction, multiplication, and division (with whole numberrs, fractions, decimals, and/or percents, mixed numbers) to solve...
Curated OER
Making Choices
Students determine that limited resources require choices. They study the basic concept of a budget and use addition, subtraction, multiplication, and division (with whole numbers, fractions, decimals and/or percents, mixed numbers) to...
Curated OER
Perimeters, Patterns, and Conjectures
Students discover patterns and write conjectures relating to perimeters and polygons. Working in cooperative learning groups, they use manipulatives and graphic organizers to solve problems then answer a series of questions in which they...
Curated OER
Ima's Dream
Pupils compile a list of items on which a person can spend money, categorize a list of items based upon similarities, and solve mathematical problems based upon given scenarios.
Curated OER
Revamped Recipe
Fifth graders engage in a tasty lesson which assist them with proportional measurements. They use a given recipe written for 12 servings, and use a chart to determine the ingredient amounts for 30 servings (or number of students in class).
Curated OER
Cannot Buy Me Love
Students investigate the concepts that are related to finance and how it is used in the world. They take part in activities that are focused around the use of a spreadsheet while using a T-chart to simulate a ledger of credits and debits.
Curated OER
Meter Reading Using Place Value
Fourth graders read gas meters to measure cubic feet and learn place values. For this place value lesson, 4th graders watch a video about meter reading and discuss place value on the gas meter dials. Students study a related chart and...
Curated OER
Identity and Equality Properties
In this math worksheet, students solve five problems, identifying each property as it is used. They identify the used property in 9 problems.
Curated OER
What's Your Favorite Stuffed Animal?
Second graders gather information in a survey and interpret the results using a tally chart, a table, and a bar graph. They' present their results of the during the final group discussion. The subject of the survey is favorite stuffed...
Curated OER
Atlatl Lessons
Fifth graders study math patterns and relationships as well as learn about the heritage of Aboriginal peoples of Saskatchewan. In this patterns and heritage lesson, 5th graders research the daily lives of First Nations People in...
Curated OER
Comparing Candy Bars
Eighth graders identify that a ratio is a comparison of two numbers and that a proportion is an equation that equates two ratios. They identify the extremes and means of proportions, as well as the product of the extremes equals the...
Curated OER
Active Learning
Students practice using measurements and bar graphs to solve a running problem in this active Math instructional activity for various age levels. The instructional activity meets state standards in Mathematics and requires the use of...
Curated OER
Brain Booster
In this counting money worksheet, students read the chart listing the food items and their prices. Students then solve the two questions using the chart and counting the money to find the answers.


