Curated OER
Nickels and Pennies
In this counting money worksheet, students find the value of the coins and count the coin with the greater value first. Students then complete the penny and nickel chart using the word problem.
Curated OER
Santa's List Sums
In this Christmas math worksheet, students help Santa find the number of children on each street by adding the sum of boys and girls listed in the chart. Students solve 17 problems.
Curated OER
Algebra/Geometry Institute Summer 2009 - Triangles and the Pythagorean Theorem
Seventh graders find the perimeter and area of triangles. In this finding the perimeter and area of triangles lesson, 7th graders find the perimeter and area of triangles given two sides. Students find the missing side by using the...
Curated OER
Count The Letters
Students perform activities involving ratios, proportions and percents. Given a newspaper article, groups of students count the number of letters in a given area. They use calculators and data collected to construct a pie chart and bar...
Curated OER
Gremlins
First graders investigate the missing numbers on an equation chart in order to practice their addition and subtraction skills. They work with sums up to twenty and use up to twenty objects to work with subtraction equations. They listen...
Curated OER
Budgeting 101
Students identify various sources of income and discern between needs and wants as they also learn to create a personal budget. In this personal budget lesson, student understand financial scenarios as they relate to different ways...
Curated OER
Pay Check Advance Loans
Students explore the implications of obtaining loans. They assess interest rates, amount to be paid back, and the implications if they do not pay back the loan on time. Students develop a comparison chart.
Curated OER
How Much Does a Bear Weigh?
Learners estimate how many children in their class it would take to equal the mass of one adult bear. They then weigh and record their measurement on a chart to check their estimate.
Curated OER
Weather Or Not
Young scholars use the internet to find pen pals to share in their weather experiment. Individually, they research the high and low temperatures for cities within the United States and email the results to their pen pal. They also...
Curated OER
An Apple A Day
Learners create a graph that showcases their pick for favorite kind of apple. Students are given samples of a variety of apples to determine their favorite in a taste test. They a create a tally chart of favorite kinds apples and use a...
Curated OER
MOBILITY, Traveling Lightly: What’s My Footprint?
Students calculate their carbon footprint. In this environmental technology lesson, students listen to a lecture on climate change. Students brainstorm solutions to reduce environmental impact based on travel options. Students calculate...
Curated OER
Timed Multiplication Test Graphs
Students use the tools of data analysis for managing information. They solve problems by generating, collecting, organizing, displaying histograms on bar graphs, circle graphs, line graphs, pictographs and charts. Students determine...
Curated OER
Caloric Expenditure in Powwow Dancing
Sixth graders investigate the meaning of different types of Native American music and dance. They determine how this music and dance has contributed to modern music and dance. They problem solve to determine the average length of the...
Curated OER
Metric Measurement
Learners use, read and write with metric units. They practice converting from larger to smaller units. Afterwards, they construct a scale drawing of a bridge. In addition, they construct these two designs, using the same scale of 1cm to...
Curated OER
M&M Caper
Students participate in a game with M&M's to be introduced to percents and ratios. Individually, they estimate and record the number of candies they believe the bag holds and the amount of each colored candy. They open the bag and...
Curated OER
Apple Graphing
Do you like apples? Create a taste test for your first and second grade learners. Cut red, green, and yellow apples, and have learners select their favorite. After tasting all of the apples, they collect data and graph the results with...
Curated OER
Reflection on Educational Goal Setting and Self-Assessment
Third graders evaluate their performance at school. They examine their most recent spelling test scores to determine whether or not they met their goals for the test.
Curated OER
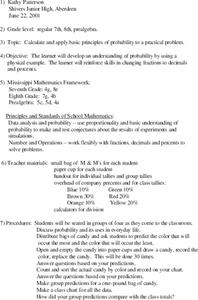
Probability using M & M's
Using M & M's candies, young statisticians predict the color distribution in a packet of candies and test their predictions against their group and the larger class. A review of converting between fractions, decimals, and percents...
Curated OER
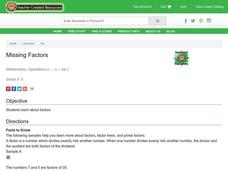
Missing Factors
Students explore factors. They discuss factors, factor trees and prime factors. Students practice working with and finding various factors and prime factors. They discuss methods used to find factors.
Curated OER
Perimeter All Around
Students explore perimeter and area of regular and irregular polygons. They experiment with color squares and create different arrangements using the same number squares. Then they compare the area and perimeter measurements of each.
Curated OER
Property Lists for Quadrilaterals
Young scholars establish classifications of shapes by various properties (angles, sides, etc.). They introduce the important properties of common shapes. Students develop an awareness of the wide variety of ways the 2-D shapes can be alike.
Curated OER
Does Sunlight Effect Leaf Size?
Students make estimates and then measure leaves for accuracy. They calculate the area of the leaves by drawing an outline on graph paper and counting the squares. They compare the leaves exposed to sunlight to those that are in constant...
Curated OER
Interpreting and Displaying Sets of Data
Students explore the concept of interpreting data. In this interpreting data lesson, students make a line plot of themselves according to the number of cubes they can hold in their hand. Students create their own data to graph and...
Curated OER
Explorations in Measurement
Students define length and area. They identify materials that can be measured with a rule and yardstick. They measure length and area when given an object.


