Curated OER
Sunshine Math- 2
In this math applications worksheet, students solve 6 varied problems that include estimation, money, basic operations, pictographs and geometry.
Curated OER
Find a Pattern
For this multiplication worksheet, students solve 6 word problems where they use skip counting or create a t-chart to find a pattern in order to arrive at an answer.
Curated OER
Five Minute Adding Frenzy (A)
In this five minute adding frenzy worksheet, learners problem solve one hundred addition equations within five minutes by writing the sum of the column and row numbers in each space.
Curated OER
Piggy Bank Math
In this math worksheet, students learn to count coins to show a certain amount of money. Students are asked to use an indicated number of coins to total an amount. There are 8 problems. Students make a chart to solve each.
Curated OER
Five Minute Adding Frenzy (A)
In this five minute adding frenzy worksheet, students problem solve four charts containing a hundred addition equations in each in less than five minutes for each one.
Curated OER
Spring Doesn't Bug Me
Pupils make a ladybug art item using math vocabulary and measurements of circles. Ladybugs are made using a compass. Once the bug is complete, attach a previously-written Haiku to it.
Curated OER
Cube Coloring Problem
Upper elementary and middle schoolers describe the various features of unit cubes, such as edges, corners, and faces. They also discuss how to represent measurements of a cube using exponents before engaging in various thinking and...
Curated OER
Tim and Pat at the Store: Bar Graphs
Do you like candy? Tim and Pat go to the candy store every day after school. Can you use the chart to determine how much money they spend each day? Does one spend more than the other?
Curated OER
Gold Rush California and its Diverse Population
Students compare contemporary cultural differences with historical differences based on population percentage. In this cross-curriculum Gold Rush/math lesson plan, students analyze aspects of California's Gold Rush population and...
Environmental Protection Agency (EPA)
The Case of the Mysterious Renters
Upper-elementary kids examine the water usage in their own home, then use that data to solve a case in which a landlady is trying to determine how many people are living in an apartment being rented. Combine math, scientific method, and...
Inside Mathematics
Conference Tables
Pupils analyze a pattern of conference tables to determine the number of tables needed and the number of people that can be seated for a given size. Individuals develop general formulas for the two growing number patterns and use them to...
Curated OER
Graphing Data
Seventh graders solve and graph 10 different problems that include various questions related to data on a graph. First, they create bar graphs to display the data given. Then, pupils determine the random sample of a population listing...
Teacher's Guide
Adding Tens
Given a hundred chart and several examples, learners practice adding 10s. They are given a number then use the chart to aid in adding 10, 20, 30, 40, or 50. There are 25 problems to solve. Tip: Have learners color in all the tens prior...
Mathed Up!
Tallys and Charts
After watching a brief instructional video, young mathematicians are put to the test. By completing and reading frequency tables, tally charts, and bar graphs, individuals show their understanding of how to interpret data.
Curated OER
Find Probability
For this probability worksheet, 4th graders answer 6 word problems using a tally chart that contains the results of rolling a dice that has the names of western states on it. They find the median, write fractions that show data, and...
Curated OER
Problem-Solving Strategy: Use Logical Reasoning: Reteach
For this math tables worksheet, students review the word problem to gain an understanding of the information in the table. Students then review the use of the model to solve the word problem. Students then use the same steps to solve the...
Curated OER
Mathematical Roadmaps
Second graders observe how a sample math problem is solved on the overhead. They work in small groups to develop a strategy for solving another problem using counters as well as a large sheet of paper to write down their explanation of...
Curated OER
Disappearing Points
In this problem solving worksheet, students complete a chart showing the scores of the players for two rounds and use the data to answer word problems. Students solve 17 problems.
Curated OER
Caloric Burning Activities
Fourth graders use problem solving, decision making and basic math skills to calculate calories used during different activities. They determine the relation between food intake and activity. Students also figure out the activity,...
Curated OER
Sixth Grade Mathematics Test
For this mathematics worksheet, 6th graders are tested on the mathematics skills. Students use problem solving strategies to work the given equations and situations.
Curated OER
Soak It Up
Learners role play where they assume the role of business executives who must decide which of three prototypes of paper towels would be the best buy for consumers. Students compare three products to determine the best value by using...
Curated OER
Let the Rain Come Down!
Second graders construct a bar graph comparing local precipitation to that of the Yucatan. In this graphing instructional activity, 2nd graders will use conversions and problem solving strategies.
Curated OER
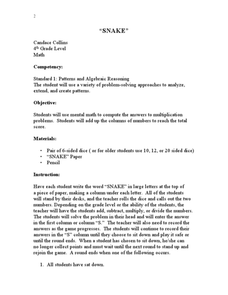
Math Activity: "Snake"
Fourth graders explore patterns by participating in a class math activity. For this early algebra lesson, 4th graders utilize a die and chart to keep record of a snake game in which students must utilize a math function to solve a...
Curated OER
Data Handling: Pictogram of Birds
In this pictograph problem solving worksheet, students analyze a pictograph of birds seen each day for a week. They use the information on the graph to solve 6 problems.


