Curated OER
Designing a Quilt Pattern
Students create and color a one-patch quilt design based upon a regular hexagon. They examine quilts and photos of quilt designs, read a handout, and complete their quilt design on a worksheet.
Curated OER
Mobile vs. Money
Students research the internet and use the information they find to plot straight line graphs. They use graphs to make comparisons of the various packages offered. Students interpret graphs and solve problems based on varying parameters.
Curated OER
Graphing Trash Material
Students investigate data and recyclable materials. In this math lesson, students save recyclable materials and create a graph of the materials. Students discuss how they could help the environment by recycling.
Curated OER
The Stock Market-Tracking and Picking Stocks
Students interpret the stock market. They pick preferable stocks based on price to earnings ratios listed in the quotes. They practice using fractions and decimals to calculate the cost of selling and buying various stocks using...
Curated OER
Calendar Communication
Students identify days, dates, and month on a calendar. In this calendar lesson, students use a blank calendar page and fill in the days of the month. Students recall what they learned on specific days and record that information as well.
Curated OER
CSI Investigation of Congruence and Similarity
Students differentiate between similarity and congruence using polygons. In this geometry lesson, students label triangles based on their properties. They find missing sides and angles using the interior sum theorem.
Curated OER
Making Parallel Lines
Students differentiate between parallel and perpendicular lines. In this geometry lesson, students make conjectures and apply it to solve real life situations. They collect data and make predictions based on the data.
Curated OER
Watershed Investigations
Students explore the components of a watershed and the factors that affect it. They read a topographical map and use geometry to determine the area of a watershed. Students estimate the volume of a body of water and perform runoff...
Curated OER
Bodacious Buttons
First graders graph a data set. Given a set of buttons, 1st graders sort them into categories using specific attributes. They graph the number of buttons in their set based on their attributes using a variety of graphs. Students share...
Curated OER
Plotting Slave Population Density in Connecticut in the 1700's
Tenth graders explore slavery in the U.S. by researching the web. In this U.S. history lesson, 10th graders identify the geography of Connecticut and the overall involvement the state had in the slavery process. Students view data of the...
Curated OER
Making Good Money Choices
Young scholars identify the needs of their community. In this communities instructional activity, students use a decision-making model worksheet to determine what community service project they should donate to. Young scholars count the...
Curated OER
WHY DOES MONEY HAVE VALUE?
Students learn that money has value by examining the history, meaning of money. market structures and pricing. In this analysis lesson plan, students use exchange rates to find the cost of an item different currencies.
Curated OER
FINANCE AND RESPONSIBLE LENDING.
Learners study the role of banks, lending and their services. In this analysis lesson, students learn about savings, checking accounts and lending and the importance of banks as financial intermediaries.
Curated OER
Monarch Butterfly Migration Map
Students examine the migration patterns of the monarch butterfly. They practice using color-coded maps. They create their own maps based on the butterfly's migration. They share their maps wtih the class.
Curated OER
IT IS ABOUT SUPPLY AND DEMAND.
Students learn that the price of an item is defined by its supply and demand. In this lesson students graph the relationship between demand and supply of various products, students also consider hidden costs.
Curated OER
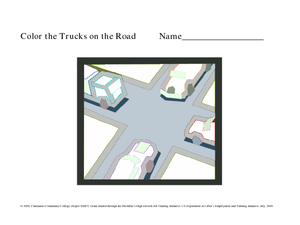
Color the Trucks
Students become familiar with the jobs of different types of trucks. In this color of trucks lesson, students decorate trucks with decorations based on the job of the truck. Students describe the trucks they've colored.
Curated OER
Force and Gliders
Learners explore physics by creating data graphs in class. In this flight properties lesson, students read the book Flying Machine and identify the force, resistance and construction necessary to keep a glider in the air. Learners...
Curated OER
Numeracy
Students review numbers, number systems and the number operations through the use of online webpages.
Curated OER
Photo-Based Reading Projects
Learners practice using a digital camera and identify the various parts. As a class, they review recent vocabulary and signs used in their community. In groups, they take pictures of various items and write complete sentences describing...
Curated OER
The Flat Stanley Project
Students read the book Flat Stanley. In this environmental stewardship lesson, students participate in earth-friendly activities based upon the book. This lesson includes ideas such as using recycled paper to make a "paper pal."
Curated OER
It's Fun to Learn!
Students use the macro mode of the OLYMPUS FE-140 CAMERAS as virtual microscopes to explore different habitats, observe plants, soil, and insects and other creatures. They download those images on electronic files and build web pages....
Curated OER
Math League Baseball: Five Week Project
Eighth graders analyze how to use statistics, change fractions to decimal, and graph their statistics. They draft players from Major League Baseball eams and chose on player for each position, including 3 oufielders and one designated...
Curated OER
Climate and Periodic Functions: Science & Math Integration
Students complete a lab that introduce the scientific concept of climate on Earth. Following the lab, they complete further research on climate. Using average monthly temperatures students construct a mathematical model and analyze the...
Curated OER
Learning and Population Information - Where I Live
Students study their county populations in a multimedia presentation format. In this populations lesson, students work in groups of 3 to research the county populations in their state. Students chart their results in an Excel document...


