Achieve
Ground Beef
Ever wonder how a butcher creates the different types of ground beef? Young mathematicians explore the methods butchers use to create their desired ground beef quality. Given a combination of two types of meat with varying leanness,...
Curated OER
Ratio, Percent, & Proportions
Seventh graders explore the concept of percents, ratios, and proportions. In this percents, ratios, and proportion lesson, 7th graders have 237 ounces of beads to weigh. Students work in groups to weigh the beads in a way so that each...
Helping with Math
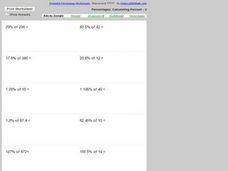
Percentages: Calculating Percent - 2
Here is a worksheet on which math classes practice calculating the percentage of different numbers. Some of the percentages involve decimals, so this would not be an assignment for first-time percent calculators! You can print the...
Curated OER
Ratio, Proportion And Percent Worksheet
In this math worksheet, students examine the answers to a formal assessment focusing on the concepts of ratio, proportion, and percent.
Curated OER
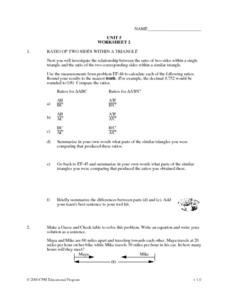
Unit 5: Worksheet 2 - Ratios
In this ratio worksheet, students investigate the relationship between the ratio of two sides of similar triangles. Afterwards, they convert fractions, decimals, and percents. This three-page worksheet contains approximately 35...
Curated OER
Ratio, Proportion And Percent
In this math worksheet, middle schoolers evaluate and compare the ratios. They also compare the fractions by solving the proportions.
Curated OER
Ratio Relationships
Students solve for the different ratio and proportion of a problem. In this geometry lesson plan, students show their knowledge of how to solve proportional relationships. They convert between percent, decimals and fractions.
Curated OER
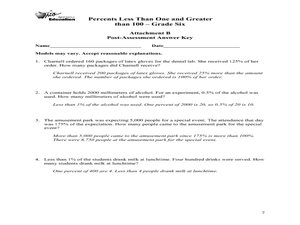
Percents Less Than One and Greater Than 100
Sixth graders express numbers as percents greater than 100 and less than one. In this lesson on percents, 6th graders work in groups with real life scenarios to develop an understanding on percentages greater than 100 and less than one....
Curated OER
The Meaning Of Percent
This lesson provides students with a variety of exercises which allow them to increase their ability to understand percentage.
Curated OER
Shots, Standings, and Shopping
Rates and ratios can easily be applied to real-world situations. Learners explore a series of websites in order to procure comparable data. They define ratios and rates, view videos, and use the internet to explore how ratios and rates...
Lane Community College
Review Sheets: Basic Mathematics 2
A good mix of Pre-Algebra problems, learners tackle everything from proportions and equations, to polygons and circles. The sections are broken up by topic with a list of the skills that are required to complete the questions.
Curated OER
Is Bigger Always Better?
Explore rational numbers with the young mathematicians in your class. They will investigate decimals, fractions, and percents before ordering and comparing rational numbers. This multi-day unit includes differentiation activities and...
Virginia Department of Education
Middle School Mathematics Vocabulary Word Wall Cards
Having a good working knowledge of math vocabulary is so important for learners as they progress through different levels of mathematical learning. Here is 125 pages worth of wonderfully constructed vocabulary and concept review cards....
Yummy Math
US Holiday Candy Sales
Candy is a big business! Calculate the amount of money consumers spent on major holidays—Easter, Halloween, Christmas, Hanukkah, and Valentine's Day—based on the total amount of candy sales from 2011 and the percentage of each holiday's...
Curated OER
NFL Home Field Advantage?
Does the home team have the home field advantage in football? Class members look at a graph that displays wins at home and wins on the road for each NFL team from 2002–2012. Then they answer eight word problems that look at the...
National Research Center for Career and Technical Education
Back to Basics
Your class will enjoy this Health Science lesson created by CTE and math teachers from Missouri. Learners make conversions between the apothecary system and metric and US standard measurements used in the healthcare field. The CTE...
Bowland
Public Transport
"Statistics is the grammar of science" -Karl Pearson. In the assessment task, learners read a claim made by a newspaper and analyze its conclusions. They need to think about the sample and the wording of the given statistics.
Curated OER
Build a Skittles Graph
Learners construct a bar graph with a given set of data. They calculate the ratio and percent of the data. Students discuss alternate ways of graphing the data as well as multiple strategies to approach the task.
Curated OER
Bits and Pieces - More About Percents - Online Manipulatives
In this online percentages worksheet, learners access the Library of Virtual Manipulatives web site and open the percentage tool. They use the online tool to complete 8 multi-step questions making graphical representations and finding...
Curated OER
Calculating Total From Percents
Using this short review of finding a percentage of a number, learners can practice important skills. There are twelve questions on this worksheet.
Curated OER
A Blast From The Past
Students investigate ratio and proportion as they solve problems. In this algebra instructional activity, students calculate the percent increase on salaries and convert between decimals and percents to calculate. They rate job positions...
Curated OER
Froot Loops to the Max - 1
Middle schoolers complete and solve five questions related to a box of Froot Loops cereal. First, they determine how many of each color of Froot Loops and which color has the greatest and least frequency. Then, pupils write the fraction...
Curated OER
Froot Loops to the Max - 2
In this Froot Loops to the max worksheet, students complete and solve 5 problems related to a box of Froot Loops cereal. First, they determine how many of each color is represented in the box of Froot Loops. Then, students determine...
Noyce Foundation
Mixing Paints
Let's paint the town equal parts yellow and violet, or simply brown. Pupils calculate the amount of blue and red paint needed to make six quarts of brown paint. Individuals then explain how they determined the percentage of the brown...


