Curated OER
Fashion Sense and Dollar Wise
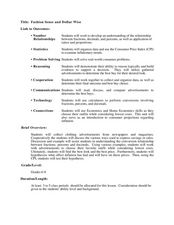
Students work in groups to show understanding of the relationship between fractions, decimals, percentages, and the application of ratios and proportions. In this decimals, fractions, and percents lesson, students use real life consumer...
Curated OER
Home Sales Records
Teach your class how to calculate monthly payments on a home mortgage. In this percent lesson, young scholars calculate the monthly payment on a home mortgage, and compare different lengths of time and the interest rates for national...
Curated OER
Working with Percentages and Proportions
In this percentages and proportions instructional activity, students are given percentages, they express them as a proportions, they create an equivalent ratio using "x" for the unknown portion and they cross multiply and divide to find...
Curated OER
Honors Algebra 2 Reivew: Practice with Sequences
In this practice with sequences worksheet, students find the arithmetic sequence and geometric sequence of given problems. They determine the percent of change and solve exponent problems. This one-page worksheet contains 11 problems.
Curated OER
What Are the Odds?
Middle schoolers identify and interpret various ways of expressing probability as a decimal, fraction, percent, or ratio. They solve problems based on probability as they apply to real world applications.
Curated OER
Froot Loops to the Max - Team Totals
In this Froot Loops to the Max worksheet, students solve 11 various problems related to determining the team totals found with Froot Loops cereal. First, they determine the number, fraction, percent, and decimal of each color of Froot...
Curated OER
Converting fraactions and percents
Sixth graders practice the conversion of percents and fractions. They focus on the fact of both fractions and percents are part of a whole. In the independent practice the students also work with solving proportions.
Curated OER
What percent of ratio is proportion?
Ninth graders investigate the concepts of ratio and proportion.They solve examples with the teacher for ratios and proportions. A basic fraction review is used for a warm up in this lesson. The primary focus of the lesson appears to be...
Curated OER
Ratios
In this percentages activity, students complete word problems dealing with percentage increases and decreases. Students complete 3 problems.
Math Drills
Trick-Or-Treat Candy Probabilities
Class members satisfy their sweet tooth with a Halloween-themed, candy probability worksheet. Using images of candy pieces that represent data, young mathematicians find the probability of getting different pieces of candy while...
Curated OER
Solving Percent Problems with Proportions
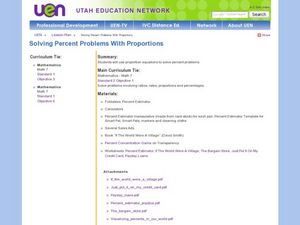
Seventh graders explore the concept of percent problems. In this percent problem lesson, 7th graders use proportion equations to solve percent problems. Students find percentages of numbers and use proportions to determine percents in...
Curated OER
Froot Loops to the Max - 3
Learners complete and solve five questions/problems related to a box of Froot Loops cereal. First, they determine how many of each color of Froot Loops are in the box. Then, pupils determine which color had the greatest frequency and...
Curated OER
Froot Loops to the Max - 4
In this Froot Loops to the Max worksheet, 5th graders solve and complete 4 different problem related to counting a box of Froot Loops cereal. First, they determine how many of each color listed there is in the box. Then, students...
Curated OER
Percentages: Calculating Percent-1
In this percentages instructional activity, students calculate percentages in eighteen problem solving percentage equations. Students show each step of their work.
Curated OER
The Foot Book
Students use estimation and measurement skills to make predictions and solve problems about length. They also analyze data presented to calculate ratios and percents.
Curated OER
Ratio and Proportions
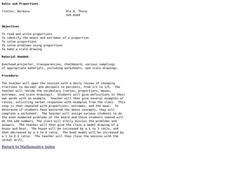
Students explore the means and extremes of a proportion, the how to make a scale drawing.
Curated OER
Population Ratios
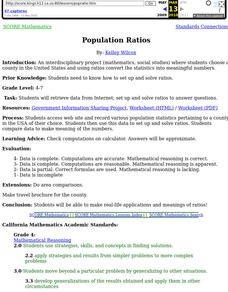
Students access web site and record various population statistics pertaining to a county in the USA of their choice. They use this data to set up and solve ratios. They compare data to make meaning of the numbers.
Curated OER
An Introduction to Percent
Fifth graders explore the concept of percents. For this percent lesson, 5th graders express fractions and decimals as percents. Students convert fractions and decimals as percents in this lecture style lesson.
Curated OER
Variations on a Human Face Lab
Ninth graders gain an application level understanding of probability, symmetry, and ratios and rates that exists in one's everyday environment relative to human genetics.
Curated OER
Percents and Money
In this algebra activity, learners rewrite word problems using algebraic symbols. They solve for the amount of population or money over a period of time. There are 10 questions with an answer key.
Curated OER
Linear Equations
Eighth and ninth graders solve and graph 42 different problems that include writing various equations and graphing them on a grid. First, they create a table for each equation and graph it on a grid locating the x-and y-intercepts. Then,...
Willow Tree
Simple Probability
The probability of learning from this instructional activity is high! Learners calculate probabilities as numbers and as decimals. They see how to use a complement to find a probability and even try a simple geometric probability problem.


