Curated OER
Pie Charts
Students create their own pie chart about their total health, being comprised of physical, social, and mental health. They label each section physical, social, and mental, and label each section with the percentage they are trying to...
Curated OER
The Unit Circle
Students relate the trigonometric functions to the coordinates of the unit circle. They classify trigonometric functions as odd or even. Students determine the signs of trigonometric functions in each quadrant. They are explained that...
Curated OER
Exploring Geometric Figures
Tenth graders explore mathematics by participating in hands-on daily activities. Learners identify a list of different shapes and classify them by shape, size, sides and vertices. They utilize tangrams and geometric pieces to gain an...
Curated OER
Slopes and Slope Intercepts
Young scholars identify the slope of an equation using various methods. In this algebra lesson, students graph linear equations and calculate the slopes using the x and y intercept to solve the equations and graph the lines. They use the...
Curated OER
Literacy Activity: The Perfect Pet
Students develop their listening skills as they listen to the book The Perfect Pet. For this reading lesson, students listen to the book, and then talk about the pets they have. Then they make a graph as a class of all their pets.
Curated OER
Activity Plan 3-4: Scrumptious Shapes
Students discover together that shapes are everywhere - even in the food we eat. In this early childhood math and art lesson, students read about shapes, identify foods that match geometric shapes, and create a class book.
Curated OER
Teddy Bear Picnic
Young scholars sit in a circle with their bears from home, each child introduces their bear, then students examine all the bears and think of one way that they can be sorted.
Curated OER
Little Boy Blue
First graders read nursery rhymes and celebrate Mother Goose. In this drawing conclusions and predicting lesson, 1st graders create new ending for the nursery rhymes. Students gather data and make a graph showing their favorite rhyme.
Curated OER
The Good, The Bad, The Ugly
Sixth graders examine the causes of the stock market crash of 1929. In this integrated math/history unit on the stock market, 6th graders study, research, and read stocks, visit a local bank, and create a PowerPoint to show the finished...
Curated OER
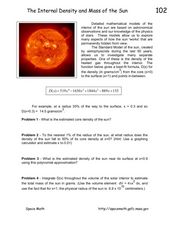
The Internal Density and Mass of the Sun
In this sun worksheet, students read about calculating the internal density and mass of the sun. Students use a given formula for the internal density of the sun's gases which students use to solve four mathematical problems.
Curated OER
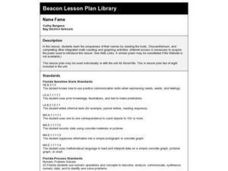
Name Fame
First graders learn the uniqueness of their names by reading the book, Chrysanthemum, and completing other integrated math counting and graphing activities.
Curated OER
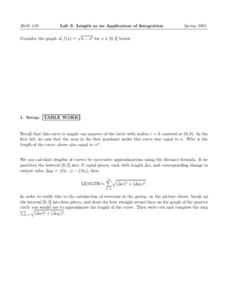
Lab 3: Length as an Application of Integration
In this integration worksheet, students graph a function that is a quarter circle curve. They calculate lengths of curves by approximation using the distance formula. Students use a computer program to calculate the approximation of the...
Curated OER
Mr. Cobbler's Shoe Dilemma
Students employ statistics to solve real-world problems. They collect, organize and describe data. They make inferences based on data analysis. They construct, read, and interpret tables, charts and graphs.
Curated OER
The Ice Cream Shop
Second graders read books about ice cream and plan an ice cream sundae party for the class. They research ingredients and determine how much the party cost each student. They hold a mock opening for an ice cream store and have their party.
Curated OER
Frequency Tables and Stem-and-Leaf Plots
Students are introduced to the function of frequency tables and stem and leaf plots. In groups, they determine the frequency of their teacher coughing, ringing a bell or raising their hand. To end the lesson, they determine frequency...
Curated OER
Introduction to Graphical Representation of Data Sets in Connection to Cellular Growth
Students practice graphing relationships between variables by studying topics such as exponential growth and decay. They conduct a series of numerical experiments using a computer model and a variety of physical experiments using mold,...
Curated OER
E3 Practice Assessment - Pets
In this assessment worksheet, 3rd graders complete eight pages of math assessment. Students solve problems related to money and a bar graph. Students solve word problems involving rounding and computation.
Curated OER
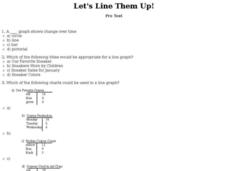
Let's Line Them Up!
In this line graph activity, students read through the problems about graphing and line graphs. Students select the best answer to solve the 10 online questions.
Curated OER
Ellipse
Students explore the concept of ellipses including finding the center, vertices's, foci and eccentricity. They assess how to graph elliptical functions and solve application problems involving ellipses. This assignment is to be completed...
Curated OER
Ellipse
Young scholars find the center, vertices, foci, and eccentricity of ellipses using the subscriptions website www.explorelearning.com. They graph elliptical functions and solve application problems involving ellipses.
Curated OER
Saving Money Through Mathematics
Third graders discuss light sources and collect data about energy sources. They compare data and create a multiple line graph showing energy used by light sources for each student in the group. They present their graphs and write a...
Curated OER
Expected Outcome (Probability)
Students practice and determine expected values of experiments as well as distributions of experiments. They find the area of rectangles and circles and determine elementary probabilities. Probability exercises begin with quarters and...
Curated OER
Expected Outcome
Students determine expected values of experiments and explore distributions of experiments. They guess as to how many times a coin will flip heads in fifty tries. They flip a coin fifty times graphing the results on a histogram. They...
Curated OER
The Dog Days of Data
Learners are introduced to the organization of data This lesson is designed using stem and leaf plots. After gather data, they create a visual representation of their data through the use of a stem and leaf plot. Students
drawing...


