Curated OER
Similarity and Dilations - Discover Properties of Similar Figures
Learners investigate properties of similar figures. In this properties of similar figures activity, pupils construct similar figures using Cabri Jr. They dilate their figure to create a similar one, and discuss the relationships between...
Chicago Botanic Garden
Climate Change Around the World
Look at climate change around the world using graphical representations and a hands-on learning simulation specified to particular cities around the world. Using an interactive website, young scientists follow the provided directions to...
Virginia Department of Education
Inequalities
Compare graphing an inequality in one variable on a number line to graphing an inequality in two variables on a coordinate plane. Young mathematicians work on a puzzle matching inequalities and their solutions. They then complete a...
Virginia Department of Education
z-Scores
Just how far away from the mean is the data point? Pupils calculate the standard deviation for a set of data and find out how many standard deviations a point is away from the mean. The teacher leads a discussion on how to calculate...
Curated OER
Wax Resist Fish
Students review what a pattern is and they create a pattern on a fish. They are reminded that patterns do not change halfway through and they paint over it with watercolor paints. They display their fish on the walls.
Curated OER
Quadratic Function Graph
Learnerss engage in a study of quadratic functions and how the coefficient of x^2 has on the graph of it. They study the quadratic function for review with the help of index cards. The lesson plan includes a resource link to align the it...
Curated OER
Adding Coins
In this coin review worksheet, learners examine a sample menu and use their addition skills to respond to 5 short answer questions regarding the cost of the items on the menu.
Curated OER
Division Problems with 0 and 1
Students explore beginning division. In this division number properties lesson plan, students solve simple division story problems using cookies. Students create models that represent the identity and zero properties, then write...
Curated OER
Measure Mania
Groups of students rotate through five classroom stations to estimate, measure, and record volume, length, weight, mass, and area using both customary and metric measure. They evaluate their data to determine how close their estimates...
Curated OER
Visualizing Vectors
Investigate vectors in standard positions and use the CellSheet application on the TI calculator to find the sum of two vectors. Convert from polar to rectangular coordinates and vice versa, and show graphs of the vectors.
Curated OER
Prime and Composite Numbers
Sixth graders investigate the concept of prime and composite numbers. They use a review of multiplication to help explain factoring. Students are taught the definition of a prime and composite number and then practice independently.
Curated OER
Addition Chart
In this addition facts review learning exercise, learners fill in the 60 blanks in an addition chart. Completion of the chart requires students to add using the numbers 1-10.
Curated OER
Multiplication Chart
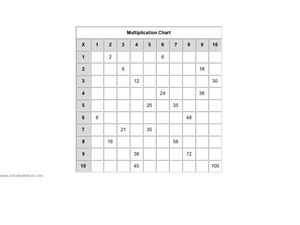
In this multiplication facts review worksheet, students fill in the 20 blanks in a multiplication chart. Completion of the chart requires students to multiply using the numbers 1-10.
Curated OER
Multiplication Chart
In this multiplication facts review worksheet, students fill in the 50 blanks in a multiplication chart. Completion of the chart requires students to multiply using the numbers 1-10.
Curated OER
Multiplication Chart 2
In this multiplication facts review worksheet, learners fill in the 80 blanks in a multiplication chart. Completion of the chart requires students to multiply using the numbers 1-10.
Curated OER
Polygon Quilt
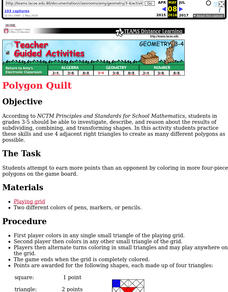
Learners participate in a game with different types of polygons. They use triangles to create as many polygons as possible. They also review their colors by having different polygons be a different color.
Texas Instruments
Finding Linear Models Part III
Explore linear functions! In this Algebra I lesson, mathematicians graph data in a scatter plot and use a graphing calculator to find a linear regression and/or a median-median line. They use the model to make predictions.
Curated OER
Geometry Review
In this geometry learning exercise, 10th graders examine and evaluate their understanding of many of the basic concepts of geometry. The six page learning exercise contains thirty-five questions. Answers are not provided.
Curated OER
Systems of Linear Equations
Introduce the inverse matrix method to solve systems of linear equations both algebraically and graphically. Using given data, your class checks their answers with graphing calculators. Handouts are included in this well-thought out lesson.
EngageNY
Examples of Functions from Geometry
Connect functions to geometry. In the ninth installment of a 12-part module, young mathematicians create functions by investigating situations in geometry. They look at both area and volume of figures to complete a well-rounded lesson.
Virginia Department of Education
Graphing Systems of Inequalities
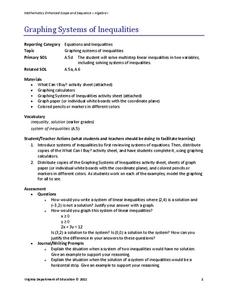
Apply systems of inequalities to a real-world problem. Here, scholars learn to graph solutions to systems of linear inequalities. To finish the lesson, they solve a problem involving burgers and cheeseburgers using a system of inequalities.
Curated OER
Exploring Quadratic Data : Transformation Graphing
High schoolers analyze the vertex form of a parabola and find an approximate fit of a model. They explain the quadratic parabola function and its properties by developing quadratic models. They use translation and dilation to change the...
EngageNY
Sampling Variability
Work it out — find the average time clients spend at a gym. Pupils use a table of random digits to collect a sample of times fitness buffs are working out. The scholars use their random sample to calculate an estimate of the mean of the...
Teach Engineering
Boxed In and Wrapped Up
If cubes have the smallest surface area, why aren't there more cube-shaped packages? Scholars take a box in the shape of a rectangular prism, cut it up, and make new boxes in the shape of cubes with the same volume. They then brainstorm...


