Curated OER
Grouping Buttons
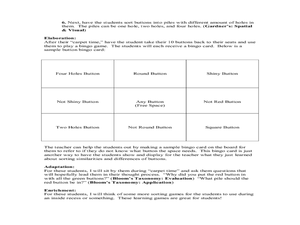
Looking for a good instructional activity on counting and sorting? This instructional activity is worth a look! In this classification instructional activity, learners sort buttons by color, shape, shiny verses not shiny, or number of...
Curated OER
Spending Log
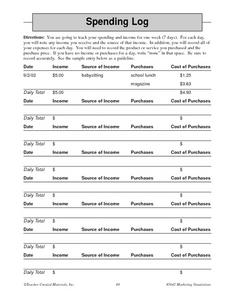
For this money management worksheet, students will track their spending and income for one week. After tracking their income and expenses, students will complete 6 short answer questions about the results.
Curated OER
Mental Math Problems
In this sequencing worksheet, students make a number sequence chart by following the given rule, continue number sequences through seven additional numbers, and continue patterns. Students solve five multiple answer problems.
Curated OER
World of the Pond
Field trip! The class will review what they know about organisms that dwell in freshwater ponds, then trek down to the old water hole to collect specimens for examination. This includes several web links, useful tips, and an excellent...
Hawaiʻi State Department of Education
Rhythm Patterns
Fractions can be tricky. Why not have kids think of fractions like they think of eighth, quarter, and half notes? In teams, the class creates four-measure patterns with their percussion instruments. They need to explain their rhythm...
Curated OER
Prairie Populations
Eleventh graders practice the Quadrat Survey Technique to analyze the biodiversity of a local plant community. They compare its biodiversity with the documented changes in biodiversity of the tallgrass prairie over time.
PBS
Remove One
With a set of 15 chips and a number line, learners predict what sums may occur with the rolling of two dice. When their sum comes up, they remove one of the chips from their number line with the objective of being the first to remove...
Curated OER
Flipping for a Grade
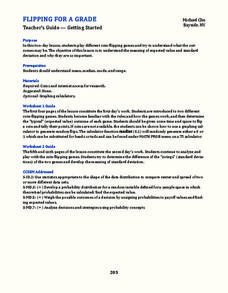
What happens when your teachers get tired of grading tests and want to use games of chance to determine your grade? How would you decide which game they should play? Learn how to use expected value and standard notation to compare two...
Curated OER
Soil Stories
Tenth graders collect and analyze soil samples and extrapolate the characteristics needed to support different types of plant life. They research different types of prairie soil and how it supports plant and animal life.
Alabama Learning Exchange
Bear Factory Probability
By examining a set of dice roll data, statisticians determine the probability of different sums occurring. They visit an interactive website and determine how many different vacation outfits Bobbie Bear will have based on the colored...
Curated OER
Experimental Probability
While just a simple lesson, this activity on experimental probability could provide a way to connect this concept to real life. Learners begin by participating in a probability activity using a coin, and then move on to create their own...
Curated OER
Division with Figures
In this division worksheet, students figure out which shapes represent which single digit number in a long division problem. Students then answer 3 questions.
Curated OER
Volume of Rectangular Prisms: Algebra/Geometry Institute Summer 2009
Students find the volume of rectangular prisms. In this volume lesson, students use a formula to find the volume of rectangular prisms. They discuss the definition of volume and draw rectangular prisms. Students identify the parts of...
Curated OER
Measurement: Measuring Hand and Feet
Here is a good activity which invites learners to practice measurement using standard and nonstandard measuring tools. In this measurement activity, learners work with length, width, height, and area. They use standard and nonstandard...
Mathed Up!
Histograms
Class members explore how to read and use histograms by watching a video on creating and analyzing histograms. To finish, the class works on a set of questions that tests these skills.
Curated OER
A Home for a Cricket
First graders build a habitat for crickets after studying animal survival needs. They care for and observe the crickets in the classroom habitat.
Curated OER
Make a Frequency Table and a Histogram for a Given Set of Data
In this data recording and data organization worksheet, learners create one frequency table and one histogram for a given list of data. Explanations and examples for frequency tables and histograms are given.
Curated OER
Design an Apartment
Students are given the task of designing an apartment. In groups, they practice estimating the area and perimeter of different shapes. After designing their space, they apply the same formulas to solving real-world story problems.
Curated OER
Groups, Clusters and Individuals
In this galaxies, clusters and planets activity, students solve 5 problems including determining sunspot groups on the sun in a particular day, finding the number of individual galaxies present, determining the number of stars in...
Alabama Learning Exchange
Pennies, Pennies and More Pennies
Learners determine the number of pennies needed to fill a room. In this pennies lesson plan, learners work in groups to determine the number of pennies needed to fill a room. They compute the probability of the head of a pin landing on...
Curated OER
Probability and Expected Value
Students collect data and analyze it. In this statistics lesson, students make predictions using different outcomes of trials.
Curated OER
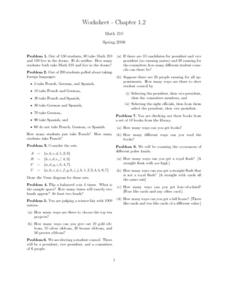
Worksheet - Chapter 1, 2 Combinations
For this combination worksheet, students draw Venn Diagrams, they determine the number of combinations of a particular event using tree diagrams or the fundamental counting principle. This one-page worksheet contains approximately eight...
Curated OER
Badminton or Basketball?
Students explain why for a group of n people, there are an equal number of possibilities for subgroups of size k (such that k < n) and size n - k.
Consortium for Ocean Leadership
Measure for Measure
How does your class measure up? Young scientists create a scale drawing of the JOIDES Resolution in a collaborative activity. The lesson incorporates mathematical principles with deep-sea exploration to focus on enhancing measurement...


