Curated OER
Probability- Many Stage Experiments
Students list the sample space of an experiment. In this statistics lesson, students calculate the number of favorable outcome in a given sample space. They define and apply mutually exclusive events versus not mutually exclusive events.
Curated OER
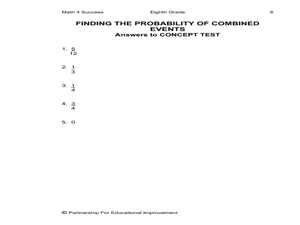
Finding the Probability of Combined Events
Eighth graders investigate the probability of combined events. For this eight grade probability lesson, 8th graders use a sample space, two events, and their intersections to determine the probability of each event, their intersection,...
Curated OER
Probability and Expected Value
Students collect data and analyze it. In this statistics lesson, students make predictions using different outcomes of trials.
University of Nottingham
Modeling Conditional Probabilities: 2
Bring the concept of conditional probability alive by allowing your classes to explore different probability scenarios. Many tasks have multiple solutions that encourage students to continue exploring their problems even after a solution...
Core Knowledge Foundation
Rocks & Minerals
Take young geologists on an exploration of the rock cycle with this six-lesson earth science unit on rocks and minerals. Through a series of discussions, demonstrations, and hands-on investigations your class will learn about the...
Curated OER
Measurement: Measuring Hand and Feet
Here is a good activity which invites learners to practice measurement using standard and nonstandard measuring tools. In this measurement activity, learners work with length, width, height, and area. They use standard and nonstandard...
Curated OER
Plaster Sculpture – subtractive method
Practice the subtractive sculpture process with your class. They'll discuss the subtractive method, art form and space, then design a sculpture which they will create from a block of plaster. Technical instructions are included.
Curated OER
Volume of Rectangular Prisms: Algebra/Geometry Institute Summer 2009
Students find the volume of rectangular prisms. In this volume lesson, students use a formula to find the volume of rectangular prisms. They discuss the definition of volume and draw rectangular prisms. Students identify the parts of...
Curated OER
Temperature High and Lows
Students gather high and low temperature readings through email. For this temperature graphing lesson, students use a spreadsheet to input data for a graph. students interpret the graphs to compare and contrast the data from different...
Curated OER
Wide Open Spaces
Students examine the problem of groundwater pollution. In groups, they develop a solution to solve the problem of a local polluted water source. They also practice measuring the space between sediment particles and the rate of water flow.
NASA
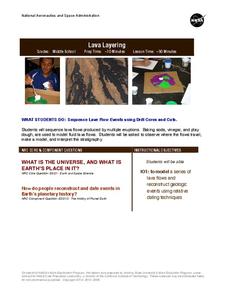
Lava Layering
Take the old baking soda and vinegar volcano to the next level by using it to study repeated lava flows over time, examine geologic features on Earth and Mars, and speculate about some of the formations on Mars.
Curated OER
Assessing the quality of habitat for Monarch Butterflies
Students use different sampling methods to determine the population size and appropriate space for monarch butterflies. In this averages lesson plan, students complete word problems where they can accurately estimate the size of an...
Alabama Learning Exchange
Pennies, Pennies and More Pennies
Learners determine the number of pennies needed to fill a room. In this pennies lesson plan, learners work in groups to determine the number of pennies needed to fill a room. They compute the probability of the head of a pin landing on...
Texas Instruments
Probability of Repeated Independent Events
Statisticians analyze different samples to find independent and dependent events. For this probability lesson, pupils predict the outcome and then calculate the real outcome. They create a tree diagram to help predict the probability of...
Curated OER
Lucky 7s
This helpful lesson explores the probability in tossing a coin and throwing dice. Specifically, it looks at the probability of getting numbers that are significant to the game of craps, assuming that once the math is understood, most...
EngageNY
The Difference Between Theoretical Probabilities and Estimated Probabilities
Flip a coin to determine whether the probability of heads is one-half. Pupils use simulated data to find the experimental probability of flipping a coin. Participants compare the long run relative frequency with the known theoretical...
EngageNY
Events and Venn Diagrams
Time for statistics and learning to overlap! Learners examine Venn Diagrams as a means to organize data. They then use the diagrams to calculate simple and compound probabilities.
Curated OER
Do You Feel Lucky?
Students explore probability by using games based on probable outcomes of events. They name all of the possible outcomes of an event and express the likelihood of such an event occurring.
Curated OER
Geometry- Hands and Feet
Students identify units of measurement. In this measurement lesson, students predict the length and width of their hands and feet. Students discuss their findings and if their predictions were correct.
Curated OER
Creating AB Patterns
Students work with patterns. In this pattern lesson, students find AB patterns in nature and the manmade world. They create their own AB pattern using math manipulatives and visual arts.
Curated OER
Data Analysis and Probability Race to the Finish
Students practice addition facts, record data, and construct a bar graph. In this probability instructional activity, students participate in a board game in which bicycles move towards a finish line based on players completing addition...
Curated OER
Deep Sea Drilling
Students explore ocean vessels that drill the ocean floor. For this ocean drilling lesson, students watch videos about drilling the ocean floor and discuss. Students get into groups, go outside and use string to mark off the amount of...
Curated OER
Analyze This
Sixth graders use a video and the internet to determine whether a game is fair or unfair. In this probabilities lesson plan, 6th graders determine the fairness of a game based on the probabilities of the outcomes.
Curated OER
How Many Ways Can A Team Win A 7-Game Series?
Students discover how many ways a team can win a 7-game series (NBA Finals, World Series, Stanley Cup) by accessing the Internet. They view sites that cover a variety of sports.


