Curated OER
How Does Your Garden Grow?
Students create a design for a school garden. For this garden design lesson, students analyze what plants grow best in their school's climate and work in teams to design a garden. Students measure the existing space, determine the...
Curated OER
An American Spy with Money To Spend
Sixth graders use their imagination, math, reading, computer, geography, and social studies skills in this unique, innovative, and fun instructional activity where students pretend to be international spies!
Curated OER
Activities to Enhance STEDII Data
Students develop an understanding of related weather processes such as wind, cloud cover, and temperature using STEDII data and instrumentation. In addition, they integrate mathematical calculations to produce a forecast map.
Curated OER
TE Activity: Nidy-Gridy
Middle schoolers make a grid and coordinate system map of their classroom as they investigate why it is important to have a common map making system. They look at how landmarks are used for navigating an area.
Curated OER
Houses
Third graders use a number of problem solving strategies in this unit of lessons. They determine how to draw and model three-dimensional objects, use co-ordinate systems, determine probability of events, and identify paths of simple...
Curated OER
Measurement
In this measurement worksheet, students measure distance with a provided ruler. Using the provided map scale, students determine the actual distance between objects. They may set up proportions to evaluate each situation.
Curated OER
Language Families
Fourth graders identify and locate the three language families of North Carolina. They calculate the physical area covered by each language family and label them on a map.
Curated OER
Tour De Texas
Students are given a budget and an alternative-fuel vehicle. Using a map of Texas, they are given a starting point and determine how to arrive at their destination within 72 hours. They use the internet to research the alternative fuel...
Curated OER
Quad Squad
Young scholars pretend they have visited a forest research station on an overnight field trip. They study forest fires, use compass directions, read maps, interpret imagery, and think about the impact of fire on ecosystems.
Curated OER
Scatter Plots
Seventh graders investigate how to make and set up a scatter plot. In this statistics activity, 7th graders collect data and plot it. They analyze their data and discuss their results.
Curated OER
Analysis of Atmospheric Conditions for a High Mountain Retreat
Learners examine the relationship between altitude, atmospheric pressure, temperature and humidity at a particular location. They practice science and math in real world applications. They write reports detailing their scientific...
Curated OER
Ocean Currents and Sea Surface Temperature
Students use satellite data to explore sea surface temperature. They explore the relationship between the rotation of the Earth, the path of ocean current and air pressure centers. After studying maps of sea surface temperature and ocean...
PBS
Home, Sweet, Home!
Young scholars investigate the local history and architecture of their community. They draw maps, conduct Internet research, discuss varied architectural designs, take a walking tour of their town and work in teams to record their...
University of Colorado
Are All Asteroids' Surfaces the Same Age?
Did you know scientists can tell the age of an asteroid by looking closely at its craters? This final lesson of a six-part series focuses on two asteroids, Gaspra and Ida, in order to demonstrate the concept of dating asteroids. Scholars...
Curated OER
What's Its Slope
Young scholars identify the slope of a lines.In this algebra instructional activity, students define the meaning of slope and write an equation given the slope. They graph linear functions using the slope and y-intercept.
Curated OER
ExplorA-Pond:4th Grade Perimeter Estimation
Fourth graders visit a real pond. They mark the pond's curvilinear perimeter using string. They measure the string to find the actual perimeter of the pond.
Curated OER
The Appearance of a Graph
Sixth graders understand that the appearance and increment used on the x and y axis in a graph change how it looks. In this graphing lesson, 6th graders work in pairs and interpret graphs using different axes. Students collect graphs...
Curated OER
A Bird's Eye View of our 50 States
Third graders focus on state birds as they learned absolute location (latitude/longitude) of each state, as well as their relative location (bordering states).
Curated OER
Measurement and Data Collecting using Image Processing
Students trace the route of the historical event and measure the distance over which the people involved journeyed. A data sheet be constructed outlining the location of events, and the speed with which the journey occurred.
Curated OER
High Mountain Retreat
Young scholars explore and analyze atmospheric conditions for a high mountain retreat. They examine the relationship between altitude, atmospheric pressure, temperature and humidity at a particular location. In addition, they write...
Curated OER
Jelly Bean's Galore
Students investigate the origins of the Jelly Bean. They complete a Scavenger Hunt using the jellybean website. Pupils create a bar graph using information collected about jelly beans. Students discuss the time of year that Jelly Beans...
Curated OER
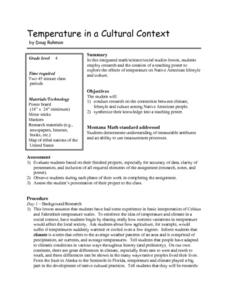
Temperature in a Cultural Context
Fourth graders investigate the effects of temperature on Native American lifestyle and culture. In small groups they conduct research on cultural practices showing a connection to the climate and create a poster displaying their...
Curated OER
Hurricane Frequency and Intensity
Students examine hurricanes. In this web-based meteorology lesson, students study the relationship between ocean temperature and hurricane intensity. They differentiate between intensity and frequency of hurricanes.
Curated OER
TE Activity: The Trouble with Topos
Students study the uses of topographical maps including the many forms that they take. They discover that the map features show its intended use such as city maps, wilderness maps, and state maps. They complete a worksheet in which they...
Other popular searches
- Map Scale Math Lessons
- Map Scale Math
- Math Map Scales
- Map Scale Math Skills
- Math Map Scales Problems
- Scale Math and Map Reading


