Curated OER
Scatterplots
Students evaluate equations and identify graphs. In this statistics lesson, students identify plotted points on a coordinate plane as having a positive, negative or no correlation. They complete basic surveys, plot their results and...
Rice University
Introductory Statistics
Statistically speaking, the content covers several grades. Featuring all of the statistics typically covered in a college-level Statistics course, the expansive content spans from sixth grade on up to high school. Material comes from a...
College Board
2015 AP® Statistics Free-Response Questions
Statistics is all about making inferences. Can you infer how your pupils will fair on their AP® exams? Collect your own data by giving them practice tests such as the 2015 free-response exam. The six-question test includes topics such as...
Radford University
Danger! – An Analysis of the Death Toll of Natural Disasters
Decipher the danger of natural disasters. Using researched data, scholars work in groups to create data displays on the number of deaths from different types of natural disasters. They share their graphical representations with the class...
American Statistical Association
Speedster
Catch me if you can. Scholars collect data on reaction time by catching a falling ruler or by using an Internet app. They determine the median of the data, create graphs, and analyze the results. They also compare their data to the rest...
Radford University
A Change in the Weather
Explore the power of mathematics through this two-week statistics unit. Pupils learn about several climate-related issues and complete surveys that communicate their perceptions. They graph both univariate and bivariate data and use...
College Board
2002 AP® Statistics Free-Response Questions Form B
Develop a deeper understanding of statistics. The six released free-response items from the 2002 AP® Statistics Form B involve several concepts that are currently in the regular statistics standards. Teachers see how AP® assessed the...
College Board
2008 AP® Statistics Free-Response Questions Form B
To know what is on the test would be great. The six free-response question from the second form of the 2008 AP® Statistics gives pupils an insight into the format and general content of the exam. Each question requires the test taker to...
California Education Partners
Science Fair Project
Plant the data firmly on the graph. Given information about the growth rate of plants, pupils determine the heights at specific times and graph the data. Using the information, scholars determine whether a statement is true and support...
Radford University
Marketing Mayhem: Advertising for Adolescents
You'll be sold on using the resource. Future consumers first conduct a sample survey on marketing strategies. They then consider how mass media influences their age groups and create presentations to display their findings.
101 Questions
Downloading
Have you ever wanted to download a great lesson, but you weren't sure if you had enough time? Scholars learn to create a function for this situation to determine when a file will finish downloading. They also learn the difference between...
Bowland
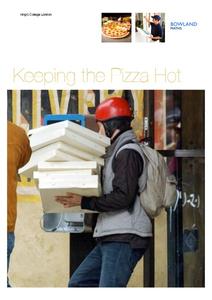
Keeping the Pizza Hot
Learners conduct an experiment to develop a cooling curve for pizza. They consider how this affects pizza delivery in terms of packing material, distance, and delivery routes.
Bowland
In the Olympics, are Women Improving Faster than Men?
Will the time come when women outperform men at the Olympic Games?Scholars investigate gender differences in Olympic Games performances. They study the historical participation of women and then analyze data to determine if women will...
PBL Pathways
College Costs
Predict the year that college costs will double in your state using linear modeling. The first part of this two-part project based learning activity asks young mathematicians to use data from the College Board. They graph the data, write...
K20 LEARN
You’re The Network: Data Analysis
How do you rate? Young scholars use graphical data to analyze ratings of different television episodes. Their analyses include best-fit lines, mean, median, mode, and range.
Concord Consortium
Gestation and Longevity
Is the gestation length of an animal a predictor of the average life expectancy of that animal? Learners analyze similar data for more than 50 different animals. They choose a data display and draw conclusions from their graphs.
College Board
2000 AP® Statistics Free-Response Questions
A little communication goes a long way. Free-response questions from the 2000 AP® Statistics exam require pupils to communicate their results—not just perform calculations. The questions ask individuals to explain, discuss, and interpret...
College Board
1998 AP® Statistics Free-Response Questions
Free-response questions form the 1998 AP® Statistics exam allow class members to analyze data from real-life situations. The situations include tracking defective parts, tracking butterflies, evaluating weed killers and determining...
College Board
2005 AP® Statistics Free-Response Questions Form B
Here's another great way to learn from the past. Released free-response questions provide a look into how concepts measured on the 2005 AP® Statistics Exam on Form B. Teachers and pupils review questions that cover concepts such as...
Radford University
Environmental Issues
Pupils investigate the air pollution situation in China by fitting a curve to historical data. They dig deeper into environmental issues that are of interest and provide a mathematical analysis of the issue. Class members develop a route...
Radford University
Government Spending
Spend some time with lines of best fit. An informative unit has learners investigate government spending. They research data on poverty, educational spending, social security, and defense spending, and then analyze lines of best fit for...
Radford University
Exploring Equations through Life Goals
What do I want to do when I grow up? Learners research job categories and determine a career within the category. Using the chosen job, pupils find the hourly wage and calculate future income based on percentage wages. Individuals then...
Radford University
Animal Decline
Where did they all go? Small groups collect data on different animal species that are on a decline. Teams develop equations to model the populations over time and then create presentations about the decline of their animals. Classmates...
Radford University
Is it Really a Small World After All?
Working in groups, learners research four countries' populations over the past 30 years. Using the data collected, the teams find regression equations that best fit the data. Taking the regression equations, they then make predictions...


